
使用 Snowflake、Amazon SageMaker Canvas 和 Amazon QuickSight 构建无代码机器学习工作流——第 2 部分:使用 Amazon SageMaker Canvas 进行数据准备和模型构建
本教程展示了如何使用 Amazon SageMaker Canvas 连接 Snowflake 数据源,通过 Data Wrangler 的可视化转换进行数据准备,并训练 XGBoost 欺诈检测模型。整个过程无需编写代码,适合业务分析师和领域专家。文章详细介绍了从创建 SageMaker 域、连接 Snowflake、执行 SQL 查询到数据转换和模型训练的步骤。
第一部分介绍了Snowflake数据库的配置,并为这个无代码机器学习(ML)工作流奠定了基础设施。
本系列博客的第二部分将介绍使用Amazon SageMaker Canvas完成数据准备和模型构建的完整工作流,演示如何直接连接到Snowflake数据源,使用Data Wrangler的可视化转换功能对数据进行转换和准备,并使用XGBoost算法构建欺诈检测模型。
Amazon SageMaker Canvas是一项可视化、无代码的机器学习服务,使业务分析师和领域专家能够构建准确的ML模型并生成预测。Amazon SageMaker Canvas为数据准备、模型训练和预测生成提供了直观的界面,在保持企业安全性和治理的同时,让机器学习在整个组织内实现民主化访问。
解决方案概述
本解决方案将引导您完成使用Amazon SageMaker Canvas准备数据和构建机器学习模型的完整工作流,并直接与您的Snowflake数据仓库集成。
前提条件
在开始本文之前,请先完成第一部分以设置您的Snowflake环境。您需要第一部分中的Snowflake账户凭据和连接信息才能完成本文中的步骤。
Amazon SageMaker Canvas设置
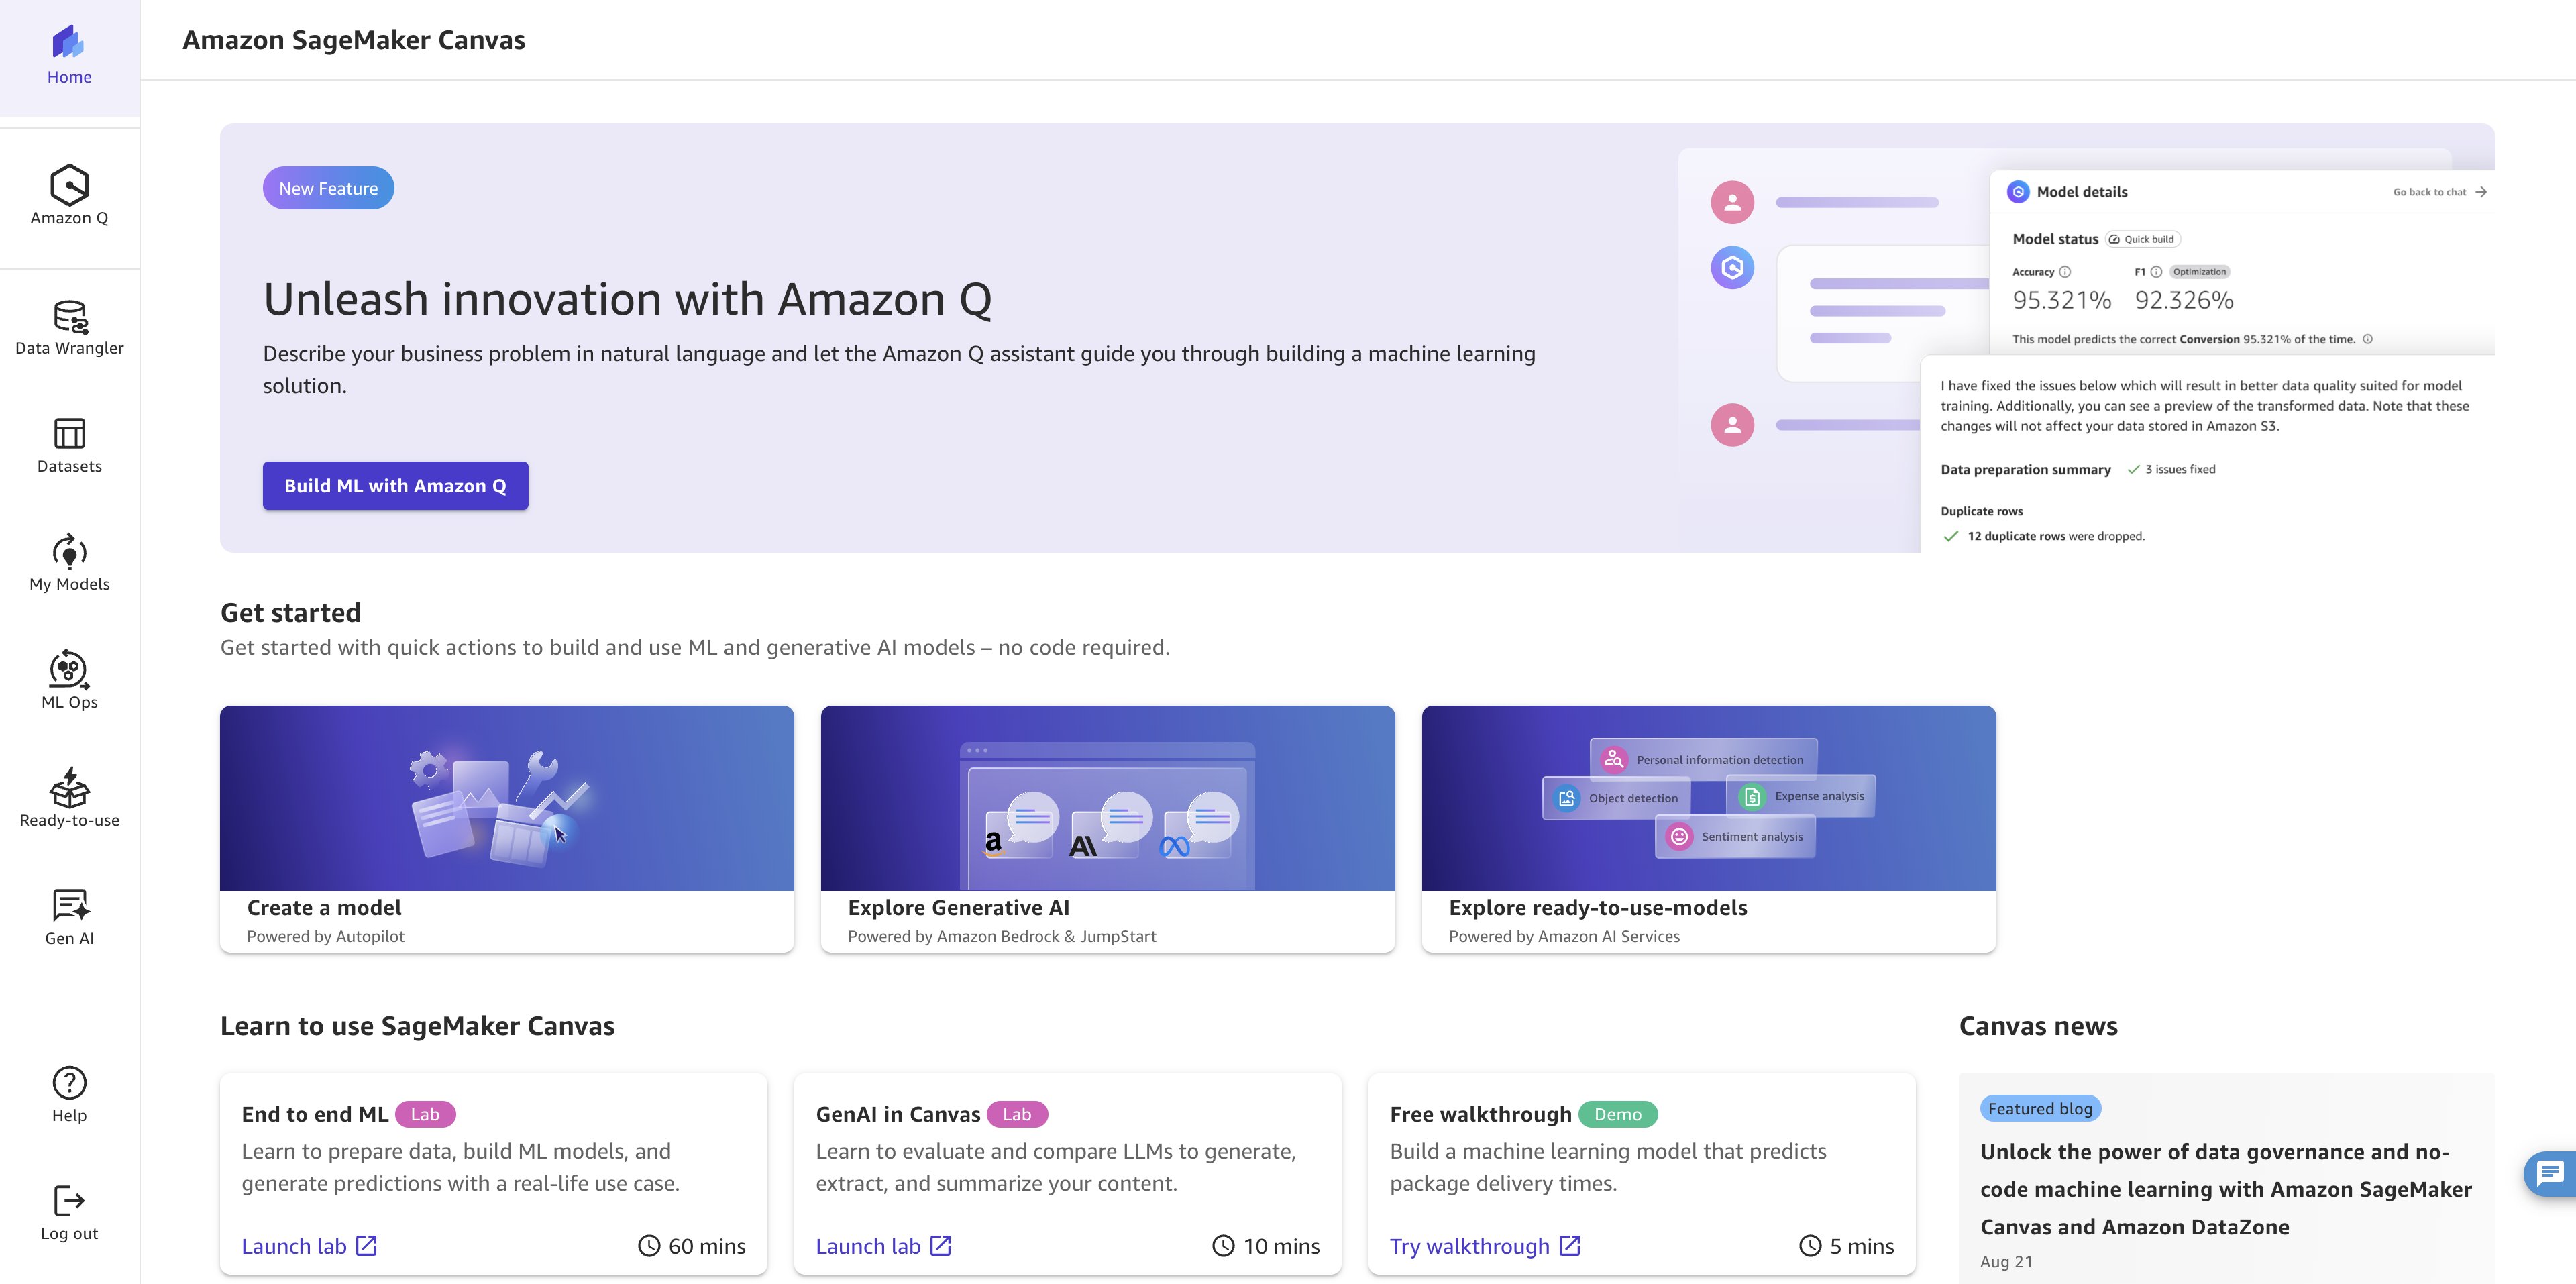
打开AWS管理控制台并搜索Amazon SageMaker Canvas。从列表中选择它,或按Enter键。
创建您的Amazon SageMaker域
域为您的Amazon SageMaker环境提供了基础组织单元。它作为一个专用工作空间,承载用户配置文件、存储配置和安全设置。每个域都提供隔离的资源和访问控制,用于管理团队协作和数据治理。
- 在左侧窗格中导航到环境配置,然后选择域。
- 选择创建域。
- 选择为单用户设置(快速设置)以自动创建您的域和用户配置文件。
启动Amazon SageMaker Canvas
- 从左侧窗格中选择Canvas。
- 选择您创建的域和用户配置文件。
- 选择打开Canvas。
- 等待3-5分钟,让Canvas准备您的工作空间。
Data Wrangler:ML数据准备
Amazon SageMaker Data Wrangler简化了机器学习工作流的数据准备工作。凭借内置转换和直观的可视化界面,Data Wrangler减少了传统上花费在数据准备和分析上的时间。对于从金融服务到医疗保健等各个行业,这一功能释放了重要价值,使领域专家能够直接准备数据进行分析。
与Snowflake的集成减少了数据移动的挑战,使用户可以直接连接到其Snowflake数据仓库,在Canvas内转换数据,并直接进入模型构建阶段。这种统一的无代码环境加速了获得洞察的时间,同时保持了数据治理和安全性。
A. 数据连接和初始设置
在本节中,您将把Amazon SageMaker Canvas连接到Snowflake数据源。
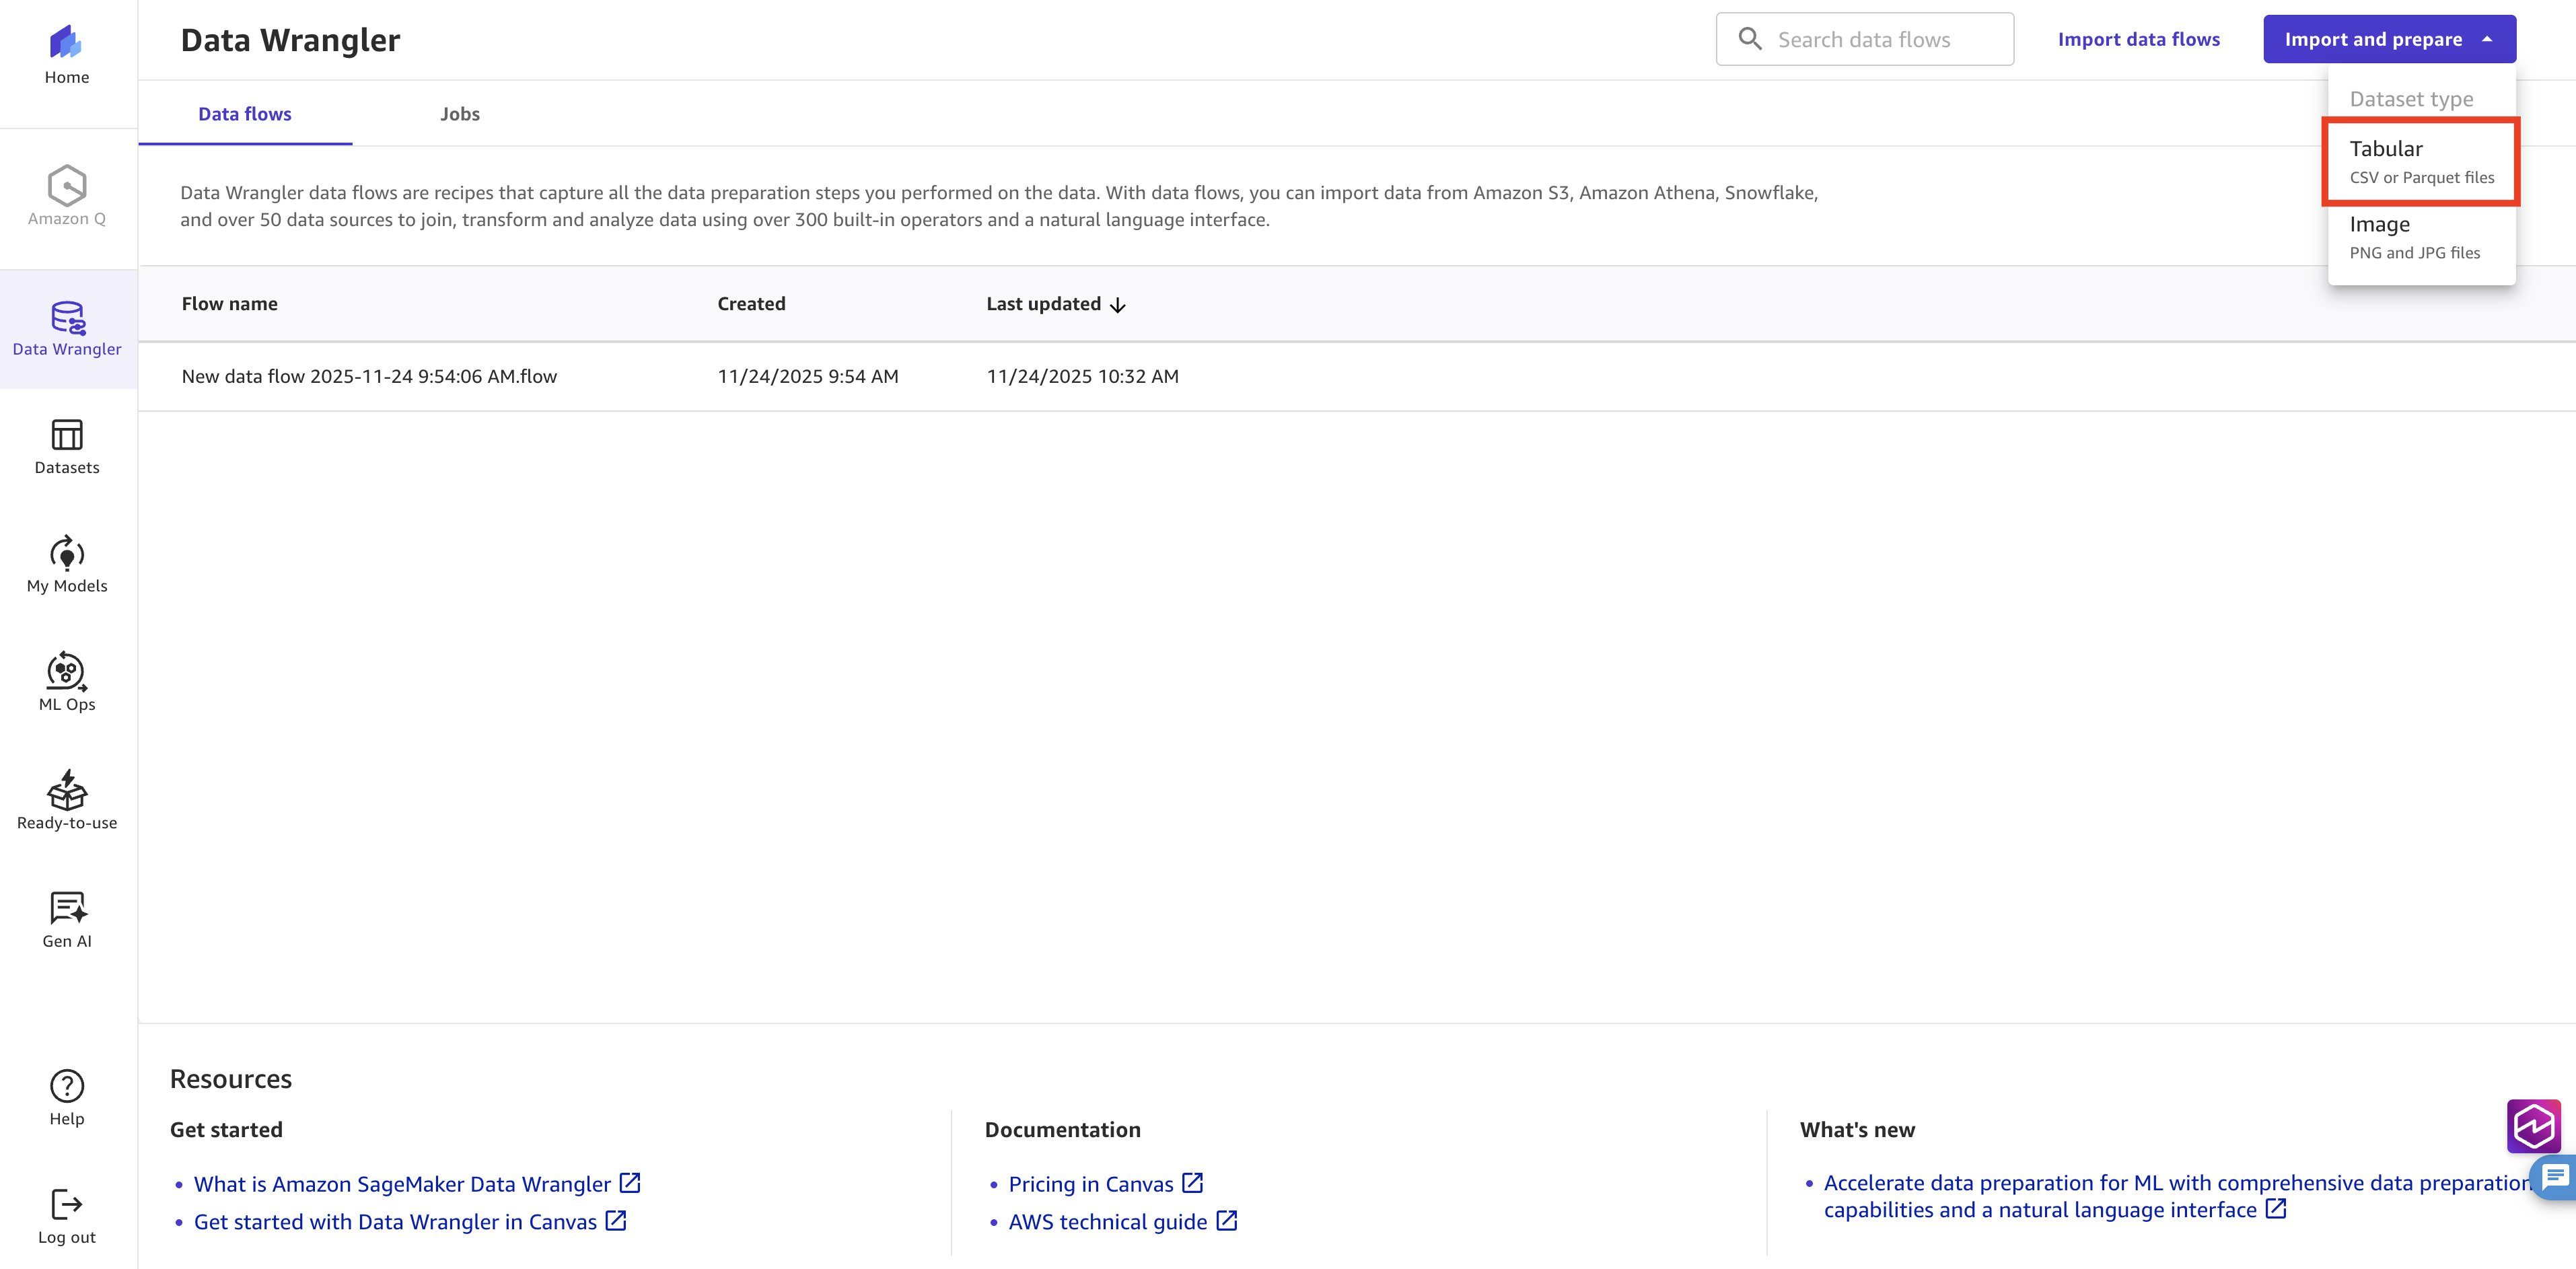
- 导航到Amazon SageMaker Canvas,并从左侧导航窗格中选择Data Wrangler。选择导入并准备,然后选择表格以处理结构化数据集。
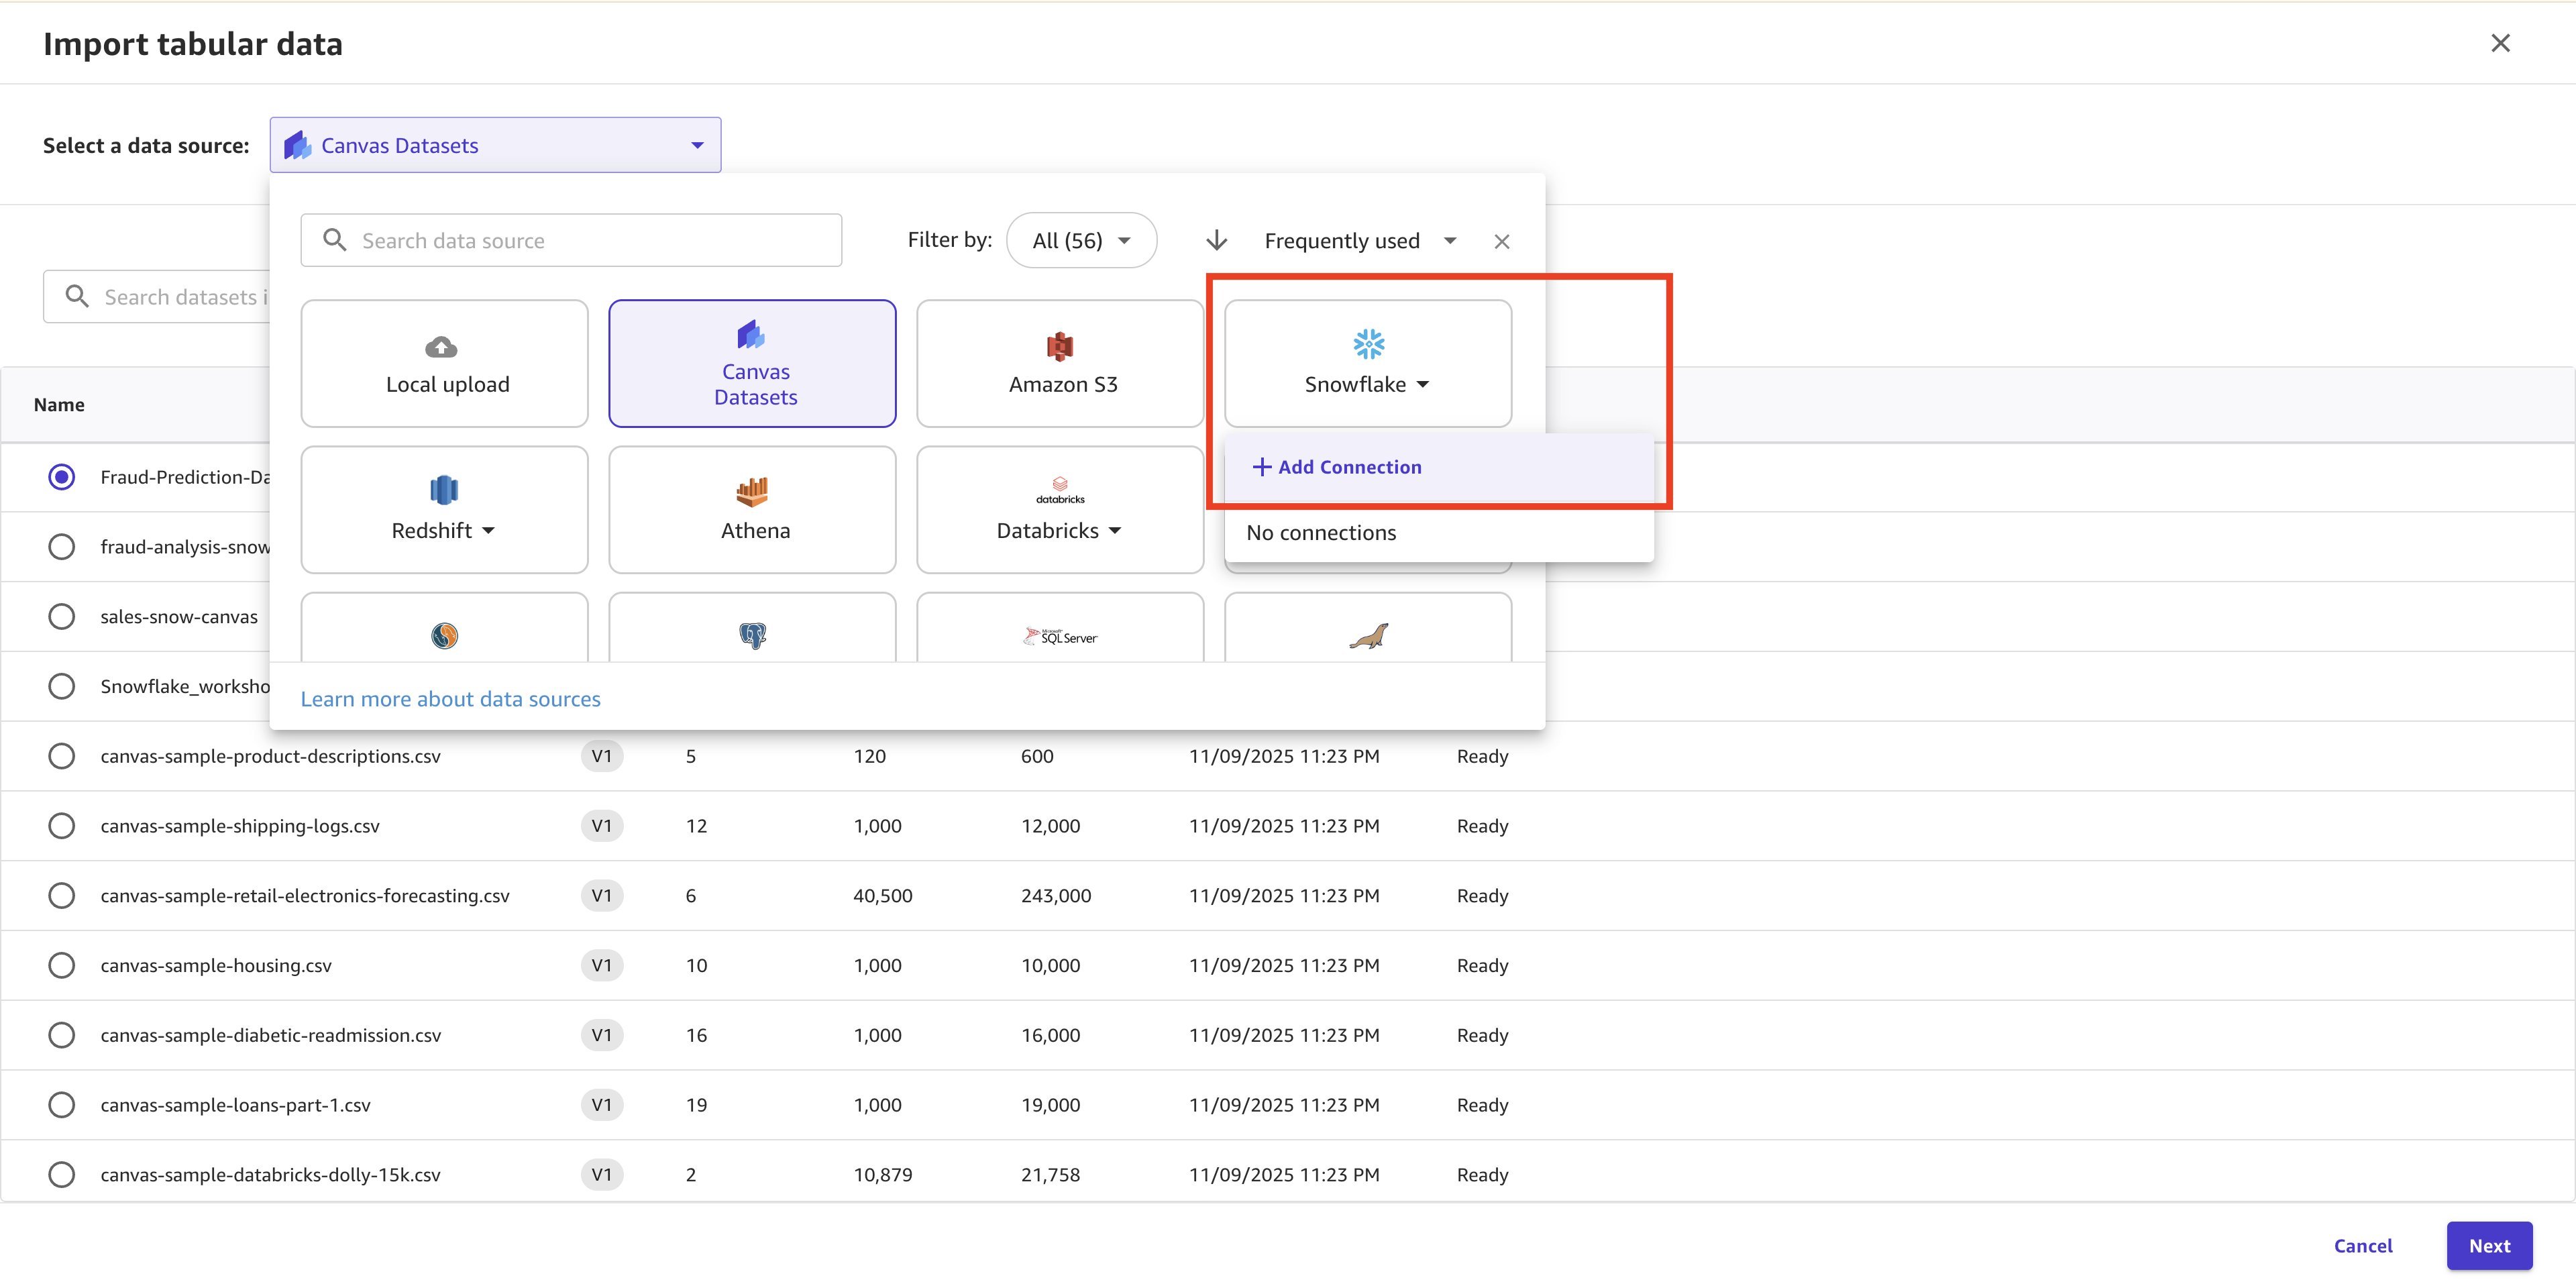
- 指定您的表格数据集来源。从数据源菜单中,选择Snowflake作为您的连接类型。然后选择添加连接以建立Amazon SageMaker Canvas与您的Snowflake环境之间的链接。通过此集成,您可以直接在Canvas内访问您的云数据仓库。这避免了手动数据导出,并确保您始终使用Snowflake实例中最新的数据。
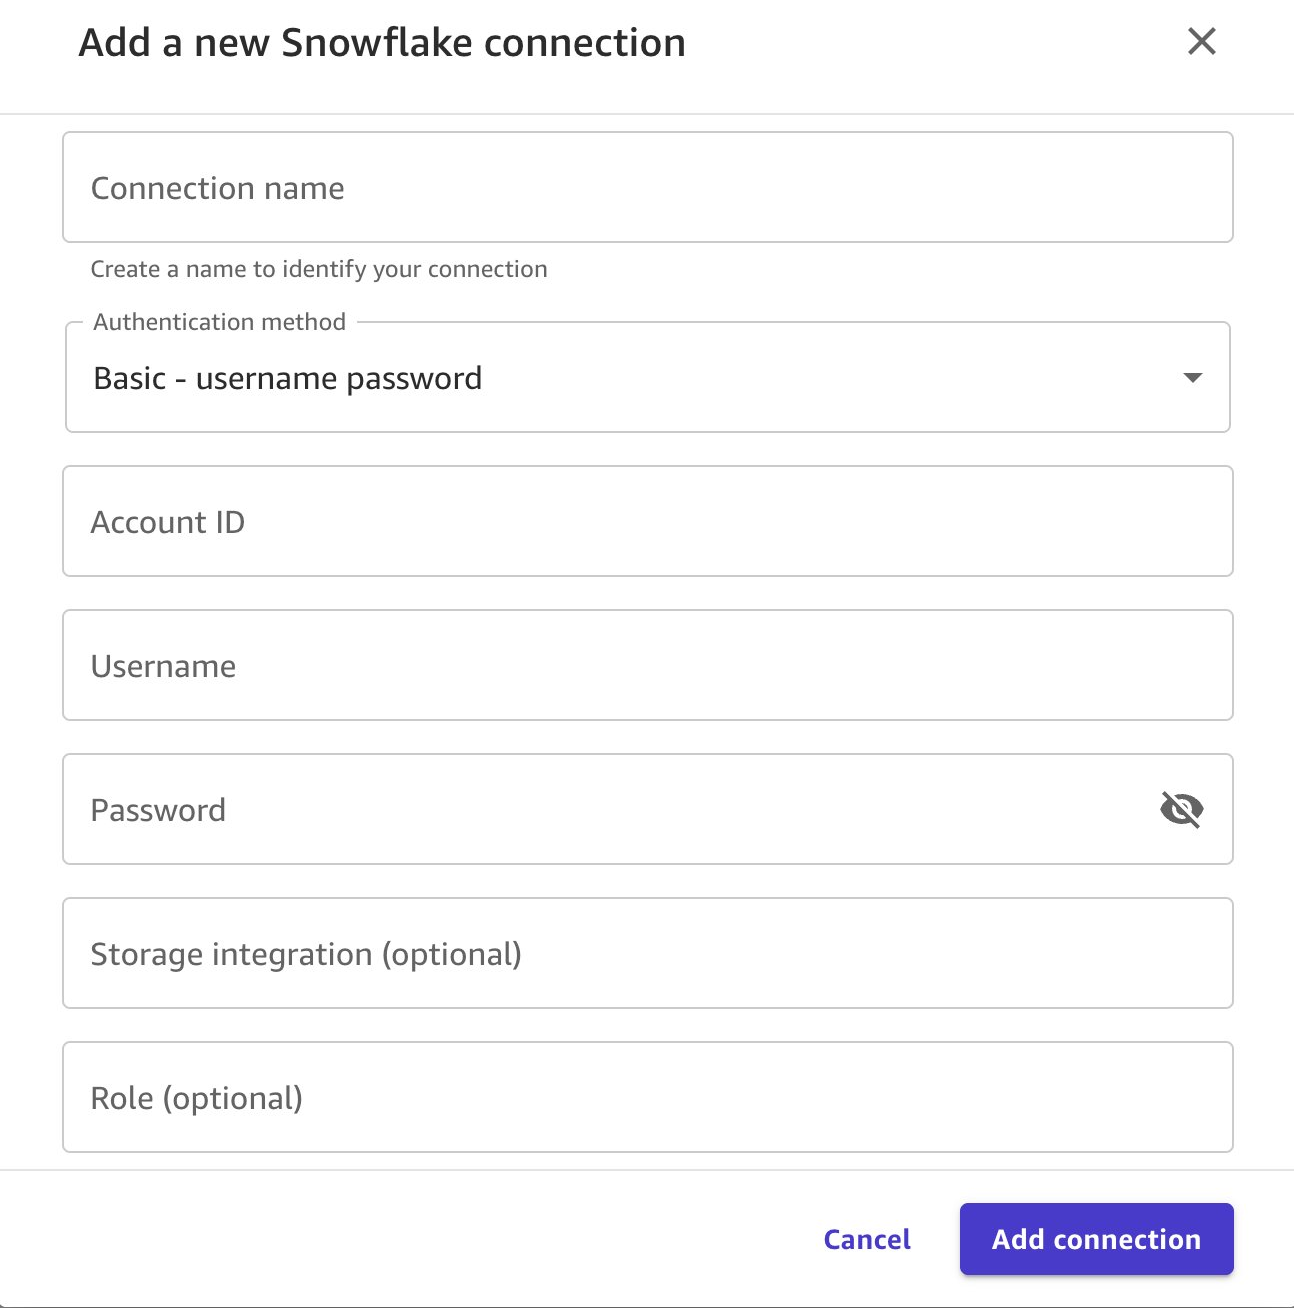
- 在Snowflake连接弹出菜单中,提供以下信息:连接名称。账户ID,设置为您的Snowflake组织值,加上连字符,再加上Snowflake账户ID。您之前设置的Snowflake账户的用户名。您之前设置的密码。
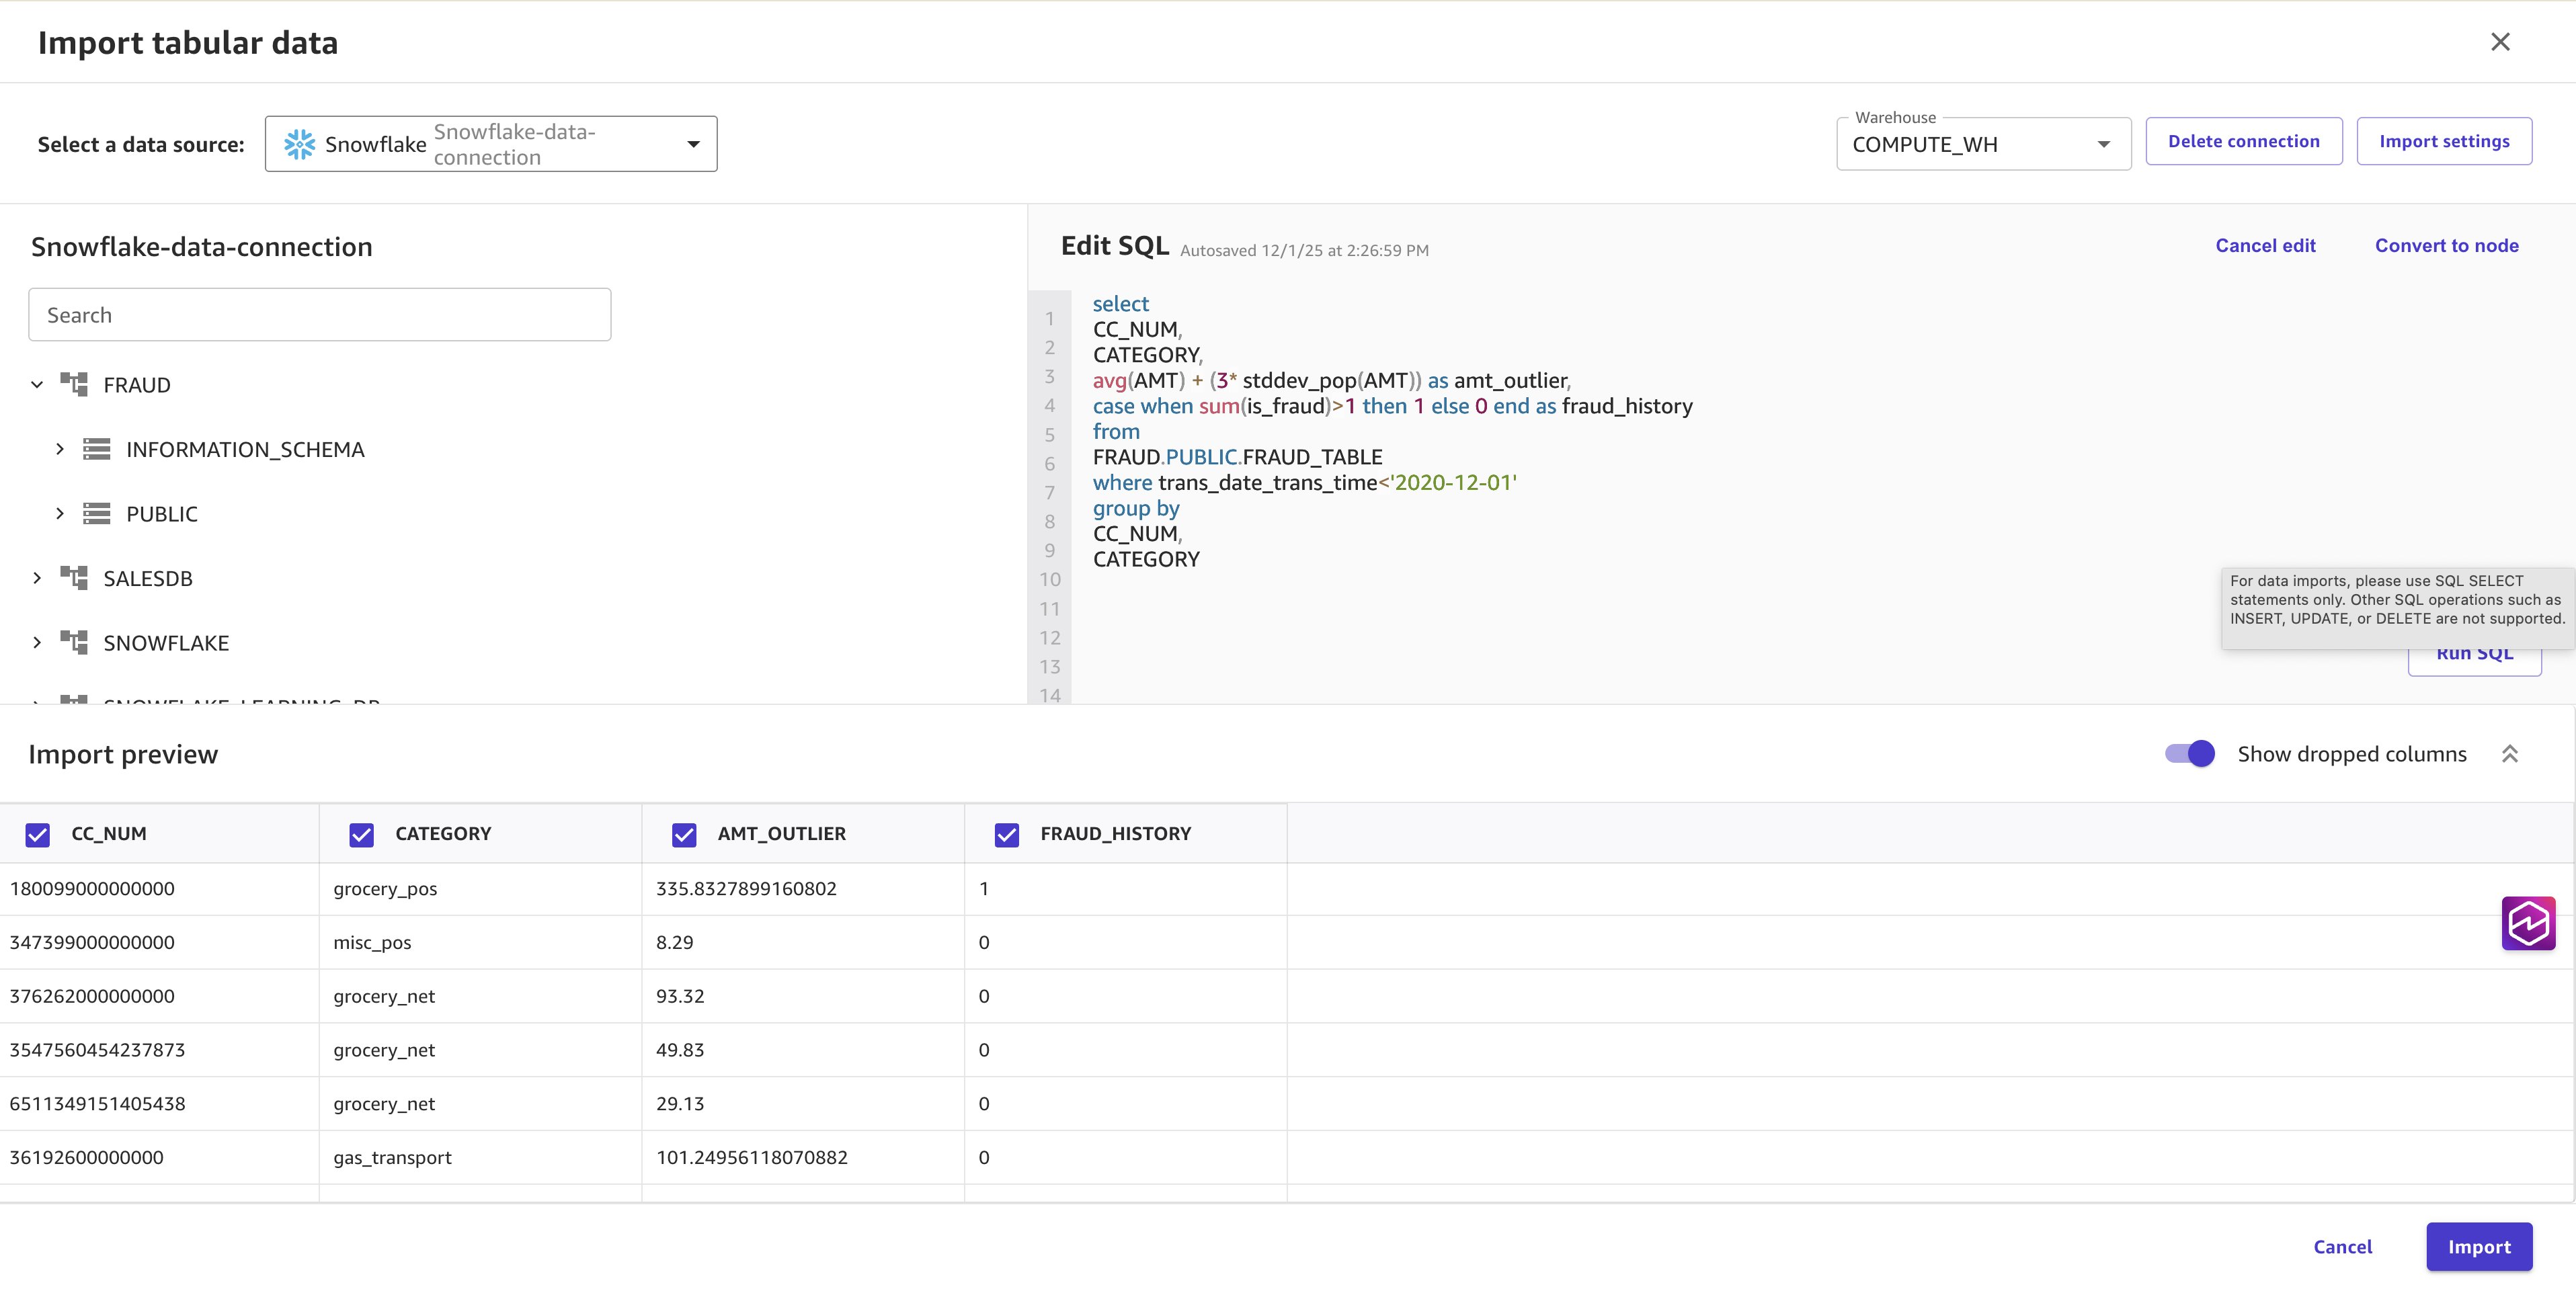
- 连接建立后,您将创建卡片级异常阈值,以识别每张信用卡和类别组合的异常消费模式。这有助于模型检测交易金额是否显著偏离持卡人的典型行为。复制SQL查询以准备欺诈检测数据集。
select
CC_NUM,
CATEGORY,
avg(AMT) + (3* stddev_pop(AMT)) as amt_outlier,
case when sum(is_fraud)>1 then 1 else 0 end as fraud_history
from
FRAUD.PUBLIC.FRAUD_TABLE
where trans_date_trans_time<'2020-12-01'
group by
CC_NUM,
CATEGORY- 运行查询:选择右上角的在SQL中编辑以打开SQL编辑器。将SQL查询粘贴到编辑器中。选择运行SQL以运行并预览结果。选择导入以将数据集导入您的Canvas工作空间。
B. 数据增强
在接下来的步骤中,您将使用交易级特征和特定于商户的欺诈指标来丰富数据集。
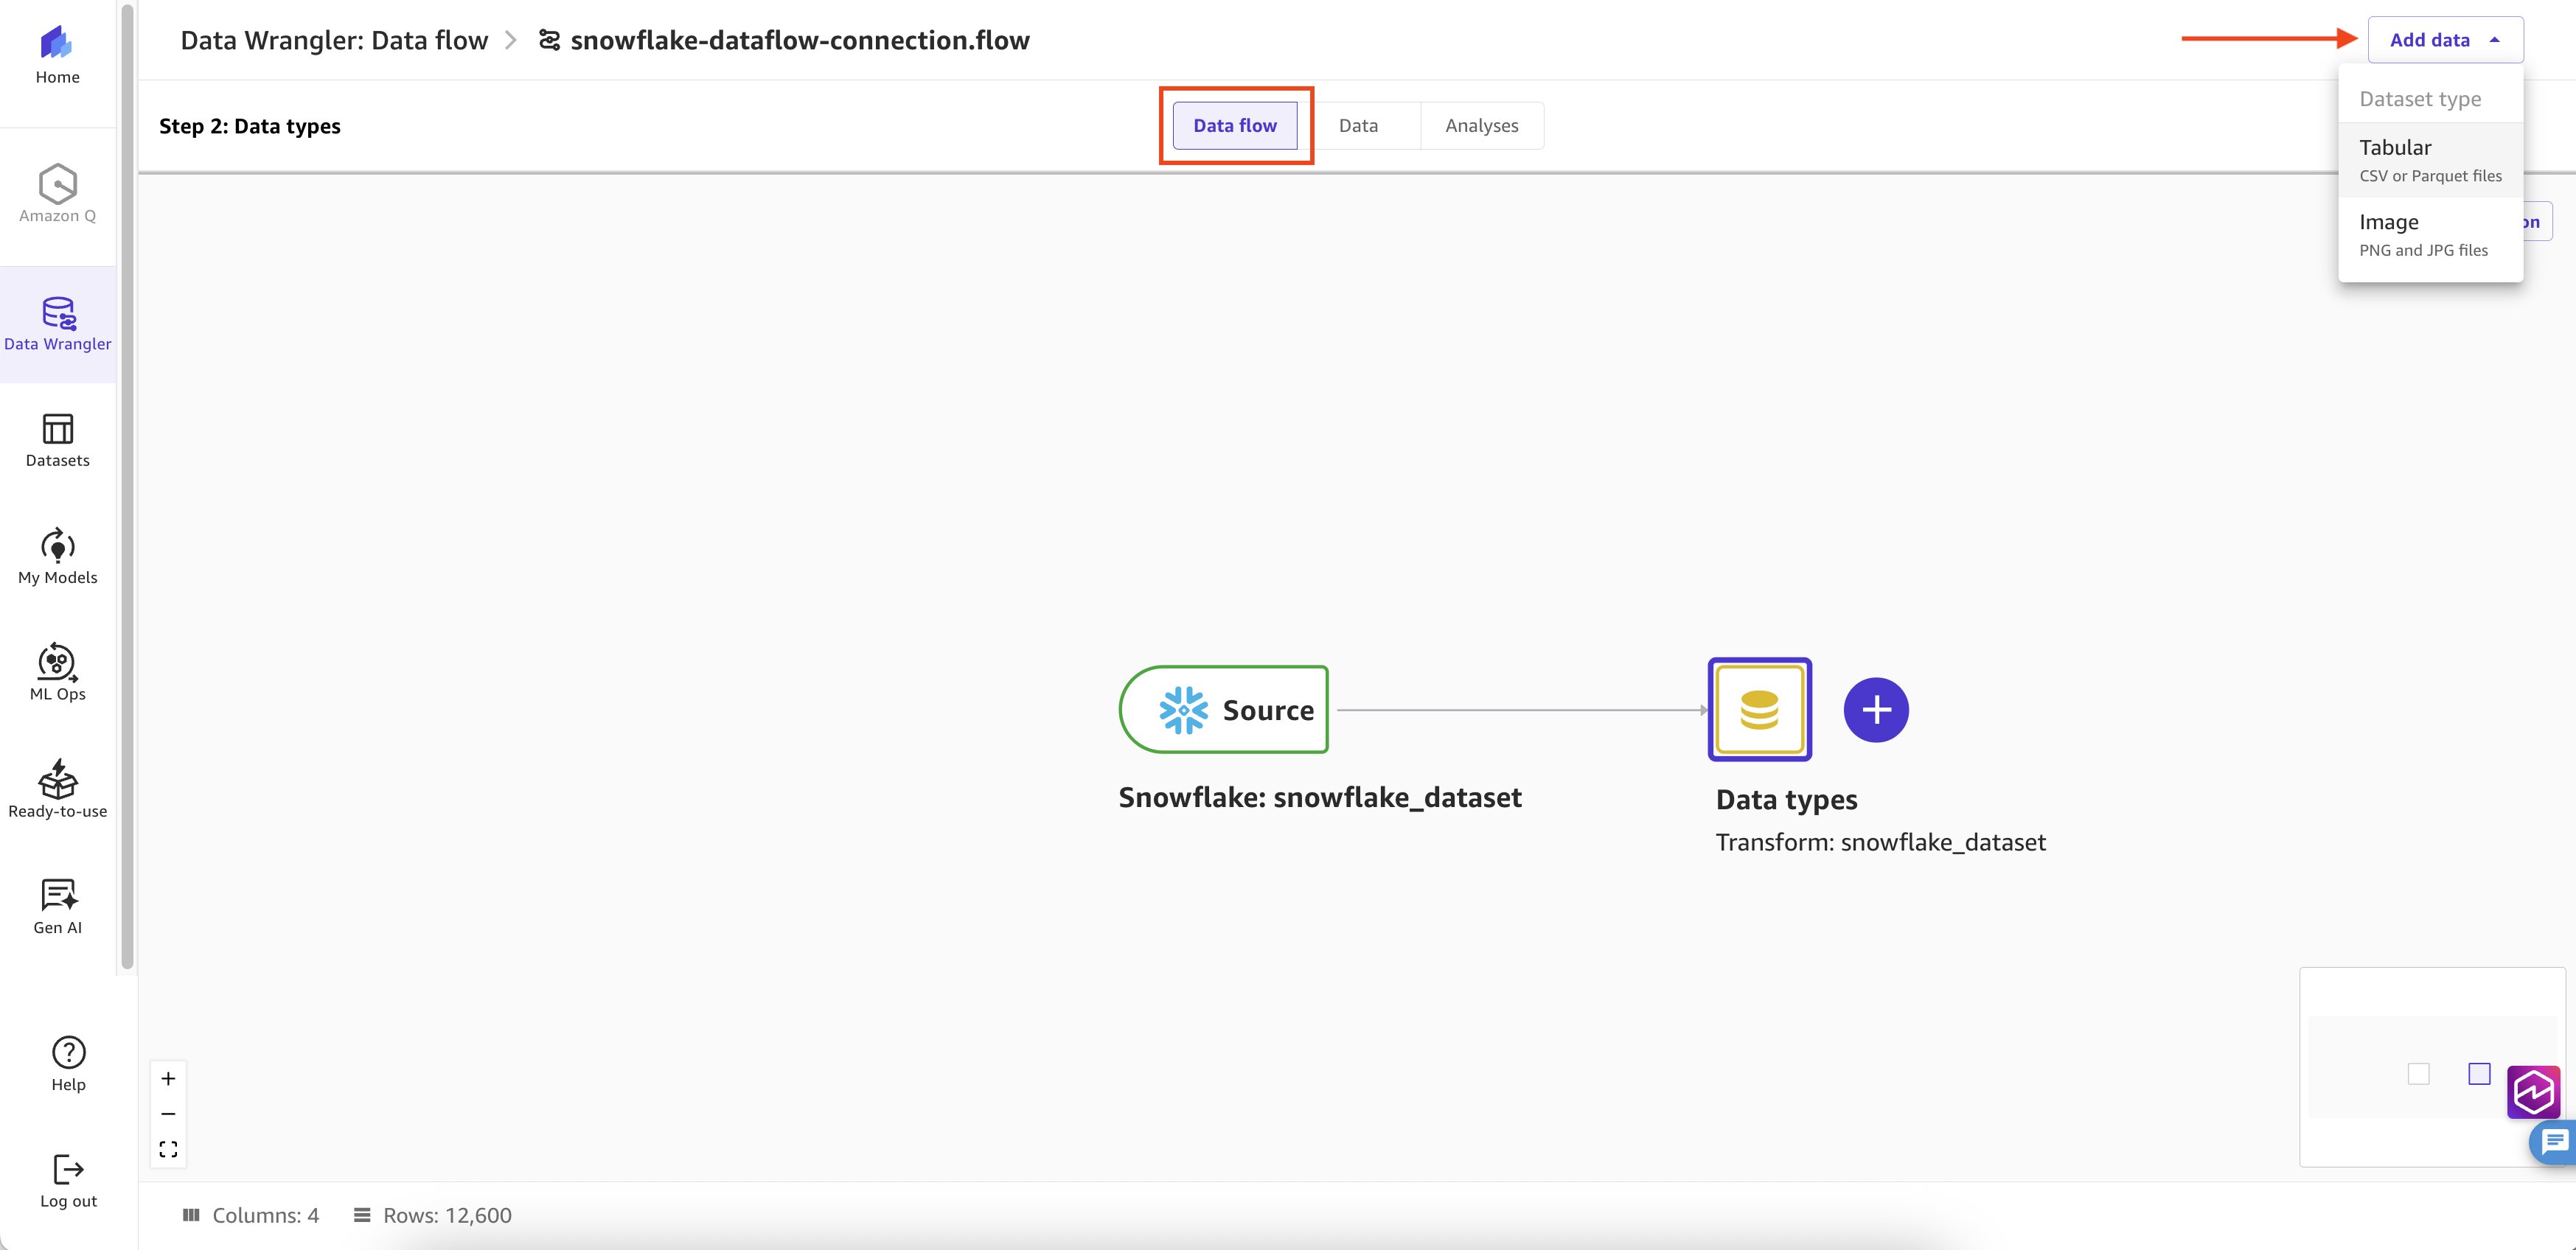
- 选择 Data flow 以添加更多数据。在右上角,选择 Add Data,然后选择 Tabular。
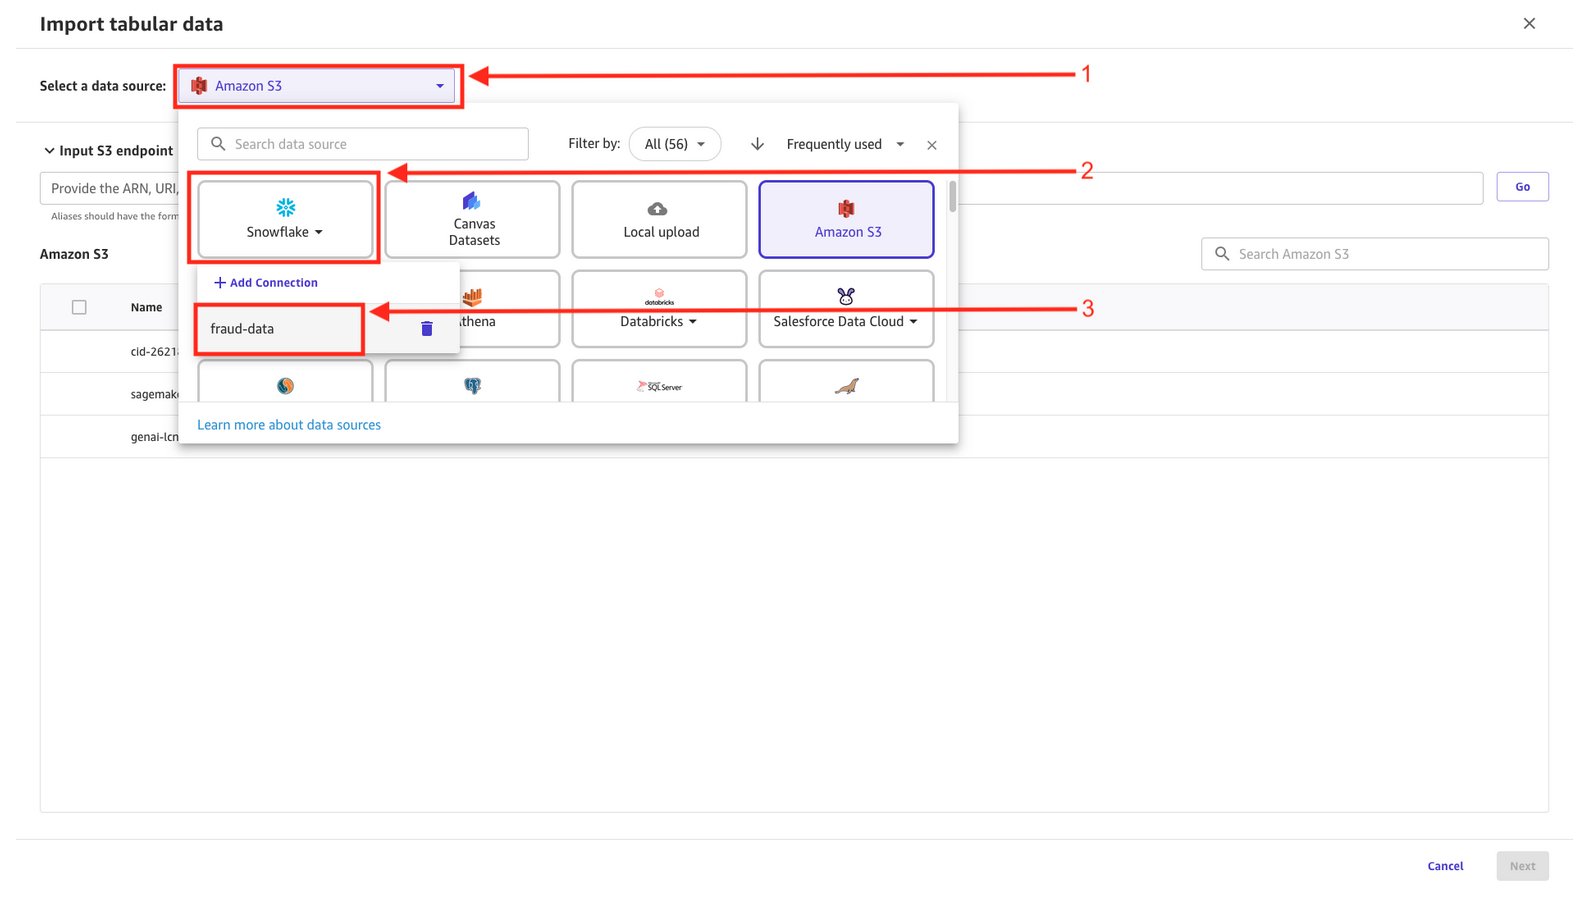
- 选择数据源为 Snowflake,以及您之前创建的现有连接。
- 在 Edit SQL 窗口中,粘贴以下 SQL 查询。该查询提供时间模式(一天中的小时、一周中的星期几)、人口统计信息(年龄类别)以及商户级别的离群值阈值,这些都是欺诈检测的关键信号。选择 Run SQL,然后选择 Import。
select
    t.MERCHANT,
    t.CC_NUM,
    'H'||extract(hour from t.TRANS_DATE_TRANS_TIME) as TRANS_HOUR,
    'D'||extract(dow from t.TRANS_DATE_TRANS_TIME) as TRANS_DOW,
    t.state,
    t.gender,
    'A'||FLOOR(DATEDIFF(YEAR, DATEADD(DAY, 1, CAST(t.dob AS DATE)), CAST(t.TRANS_DATE_TRANS_TIME AS DATE)) / 5) * 5 AS age_category,
    t.CATEGORY,
    t.IS_FRAUD,
    t.AMT,
    m.merchant_amt_outlier,
    m.merchant_fraud_history
from
    FRAUD.PUBLIC.FRAUD_TABLE t
left join (
    select
        MERCHANT,
        avg(AMT) + (3* stddev_pop(AMT)) as merchant_amt_outlier,
        case when sum(is_fraud)>1 then 1 else 0 end as merchant_fraud_history
    from
        FRAUD.PUBLIC.FRAUD_TABLE
    where trans_date_trans_time<'2020-12-01'
    group by MERCHANT
) m on t.MERCHANT = m.MERCHANT
where t.trans_date_trans_time<'2020-12-01'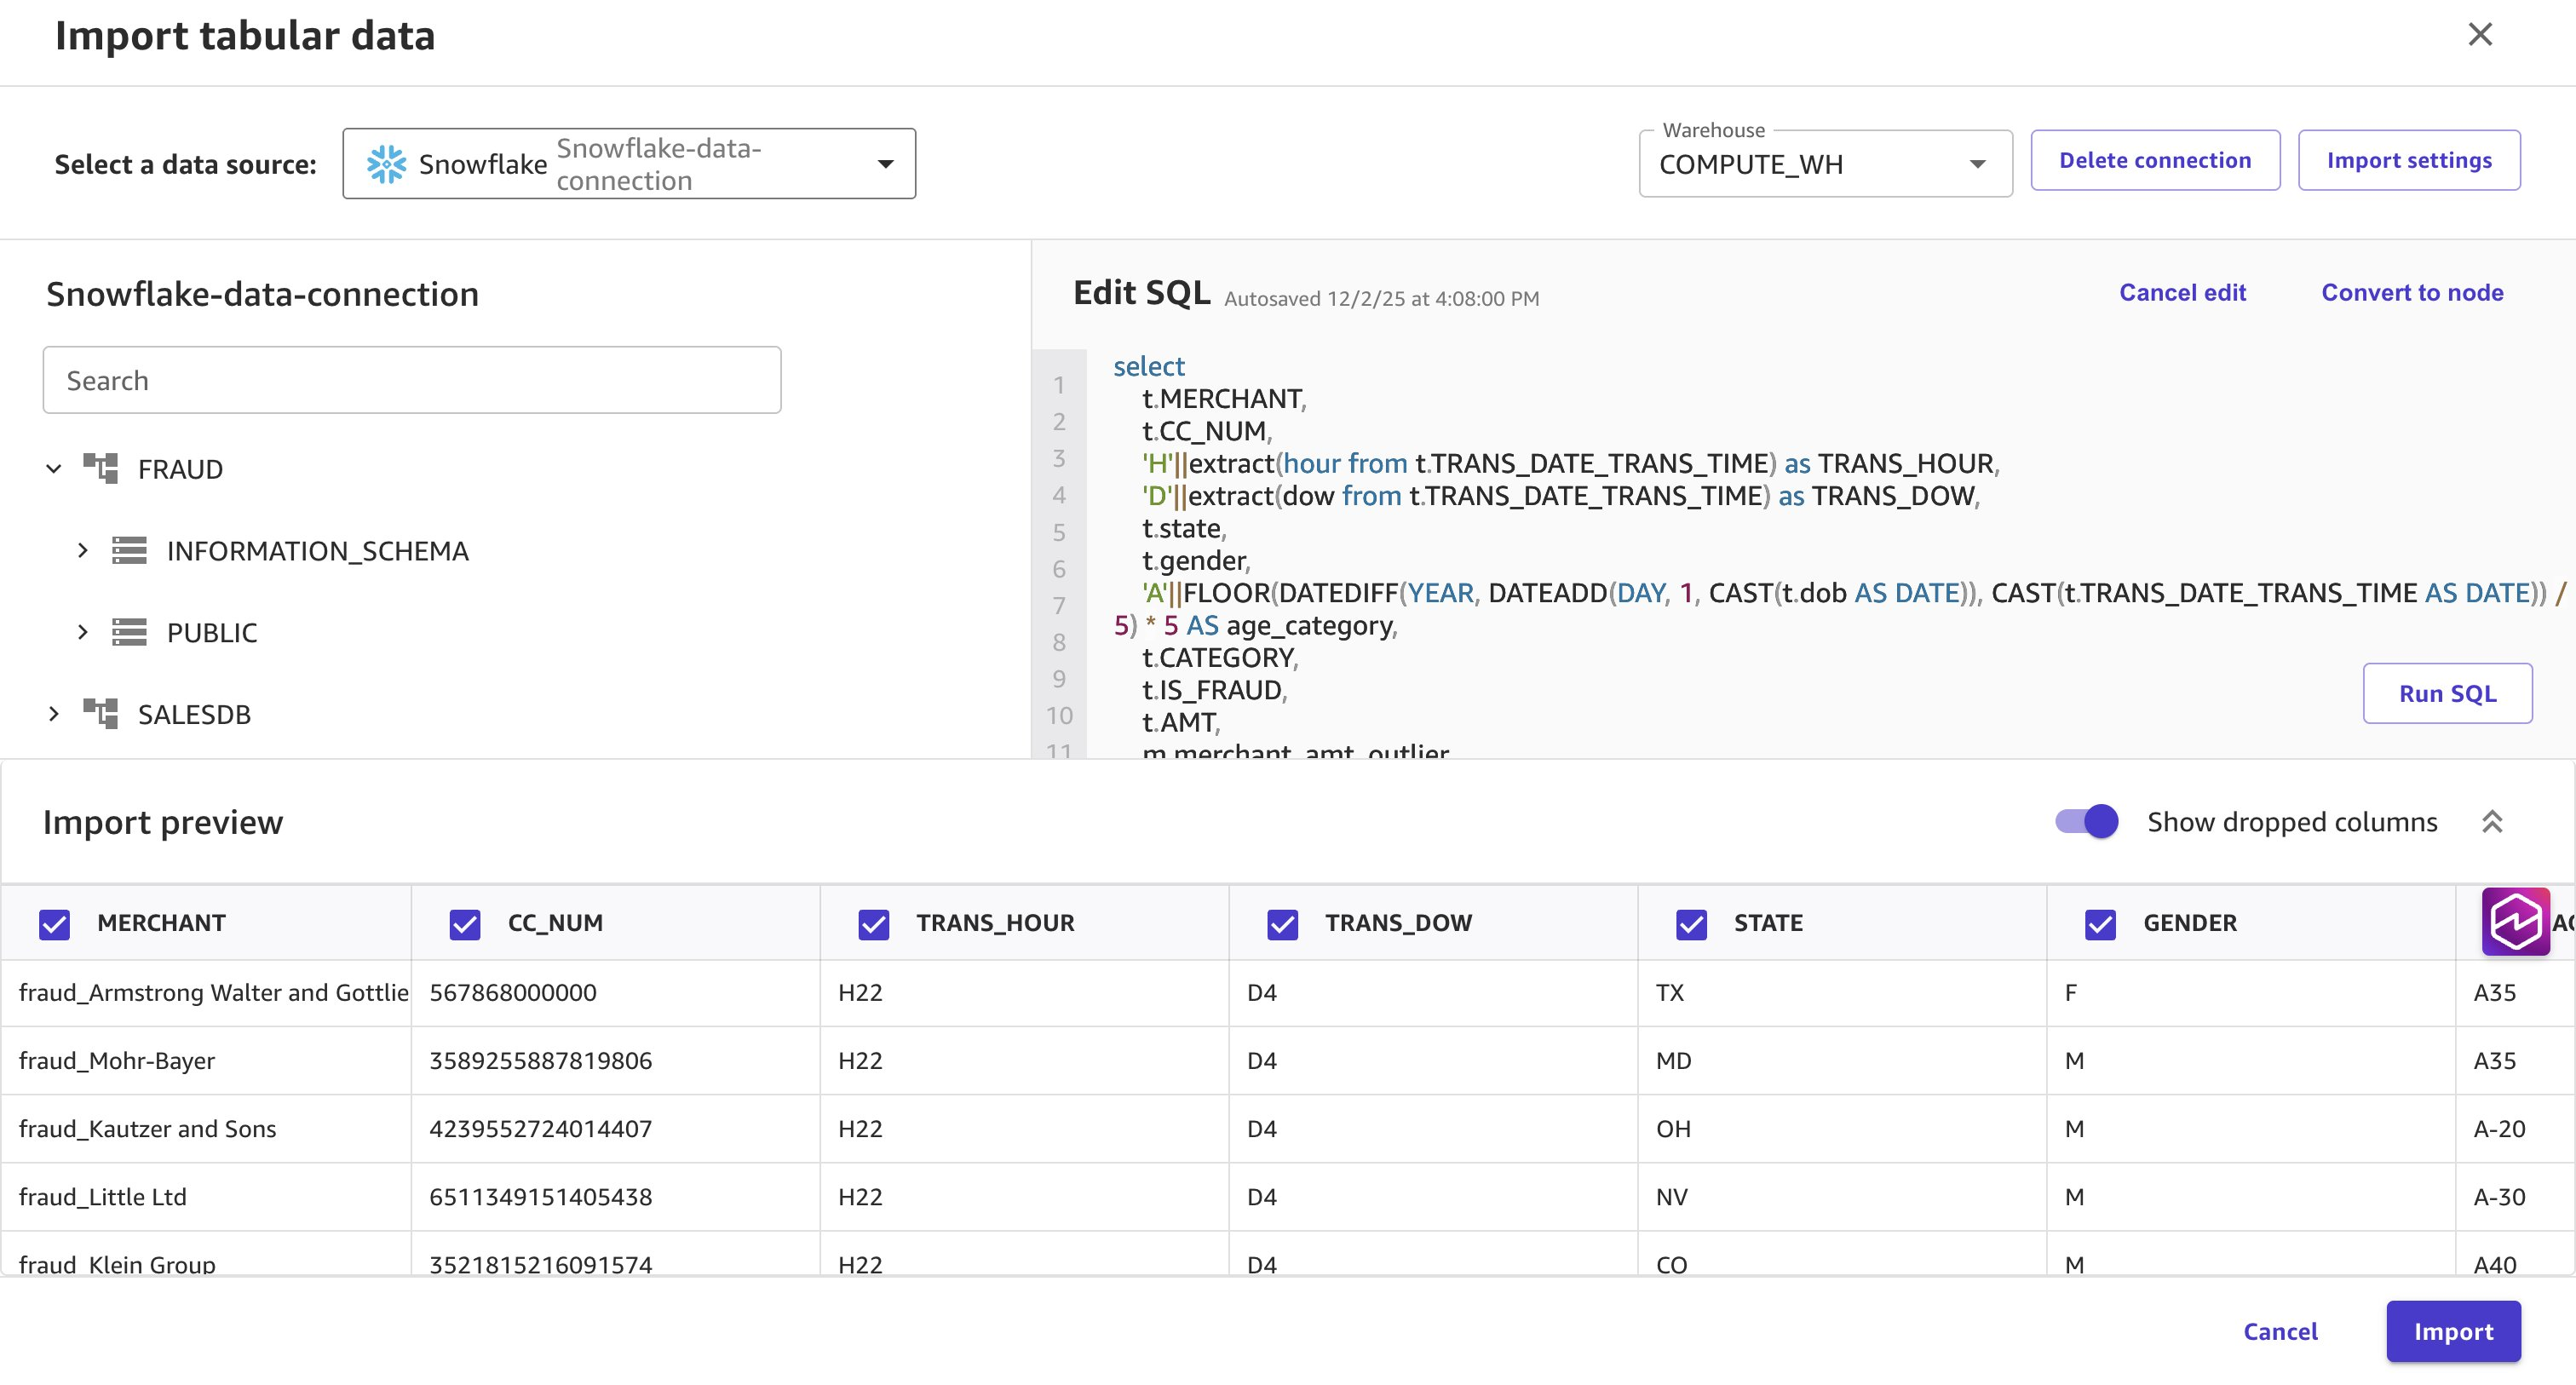
C. 数据转换
在本节中,您将把数据连接在一起。
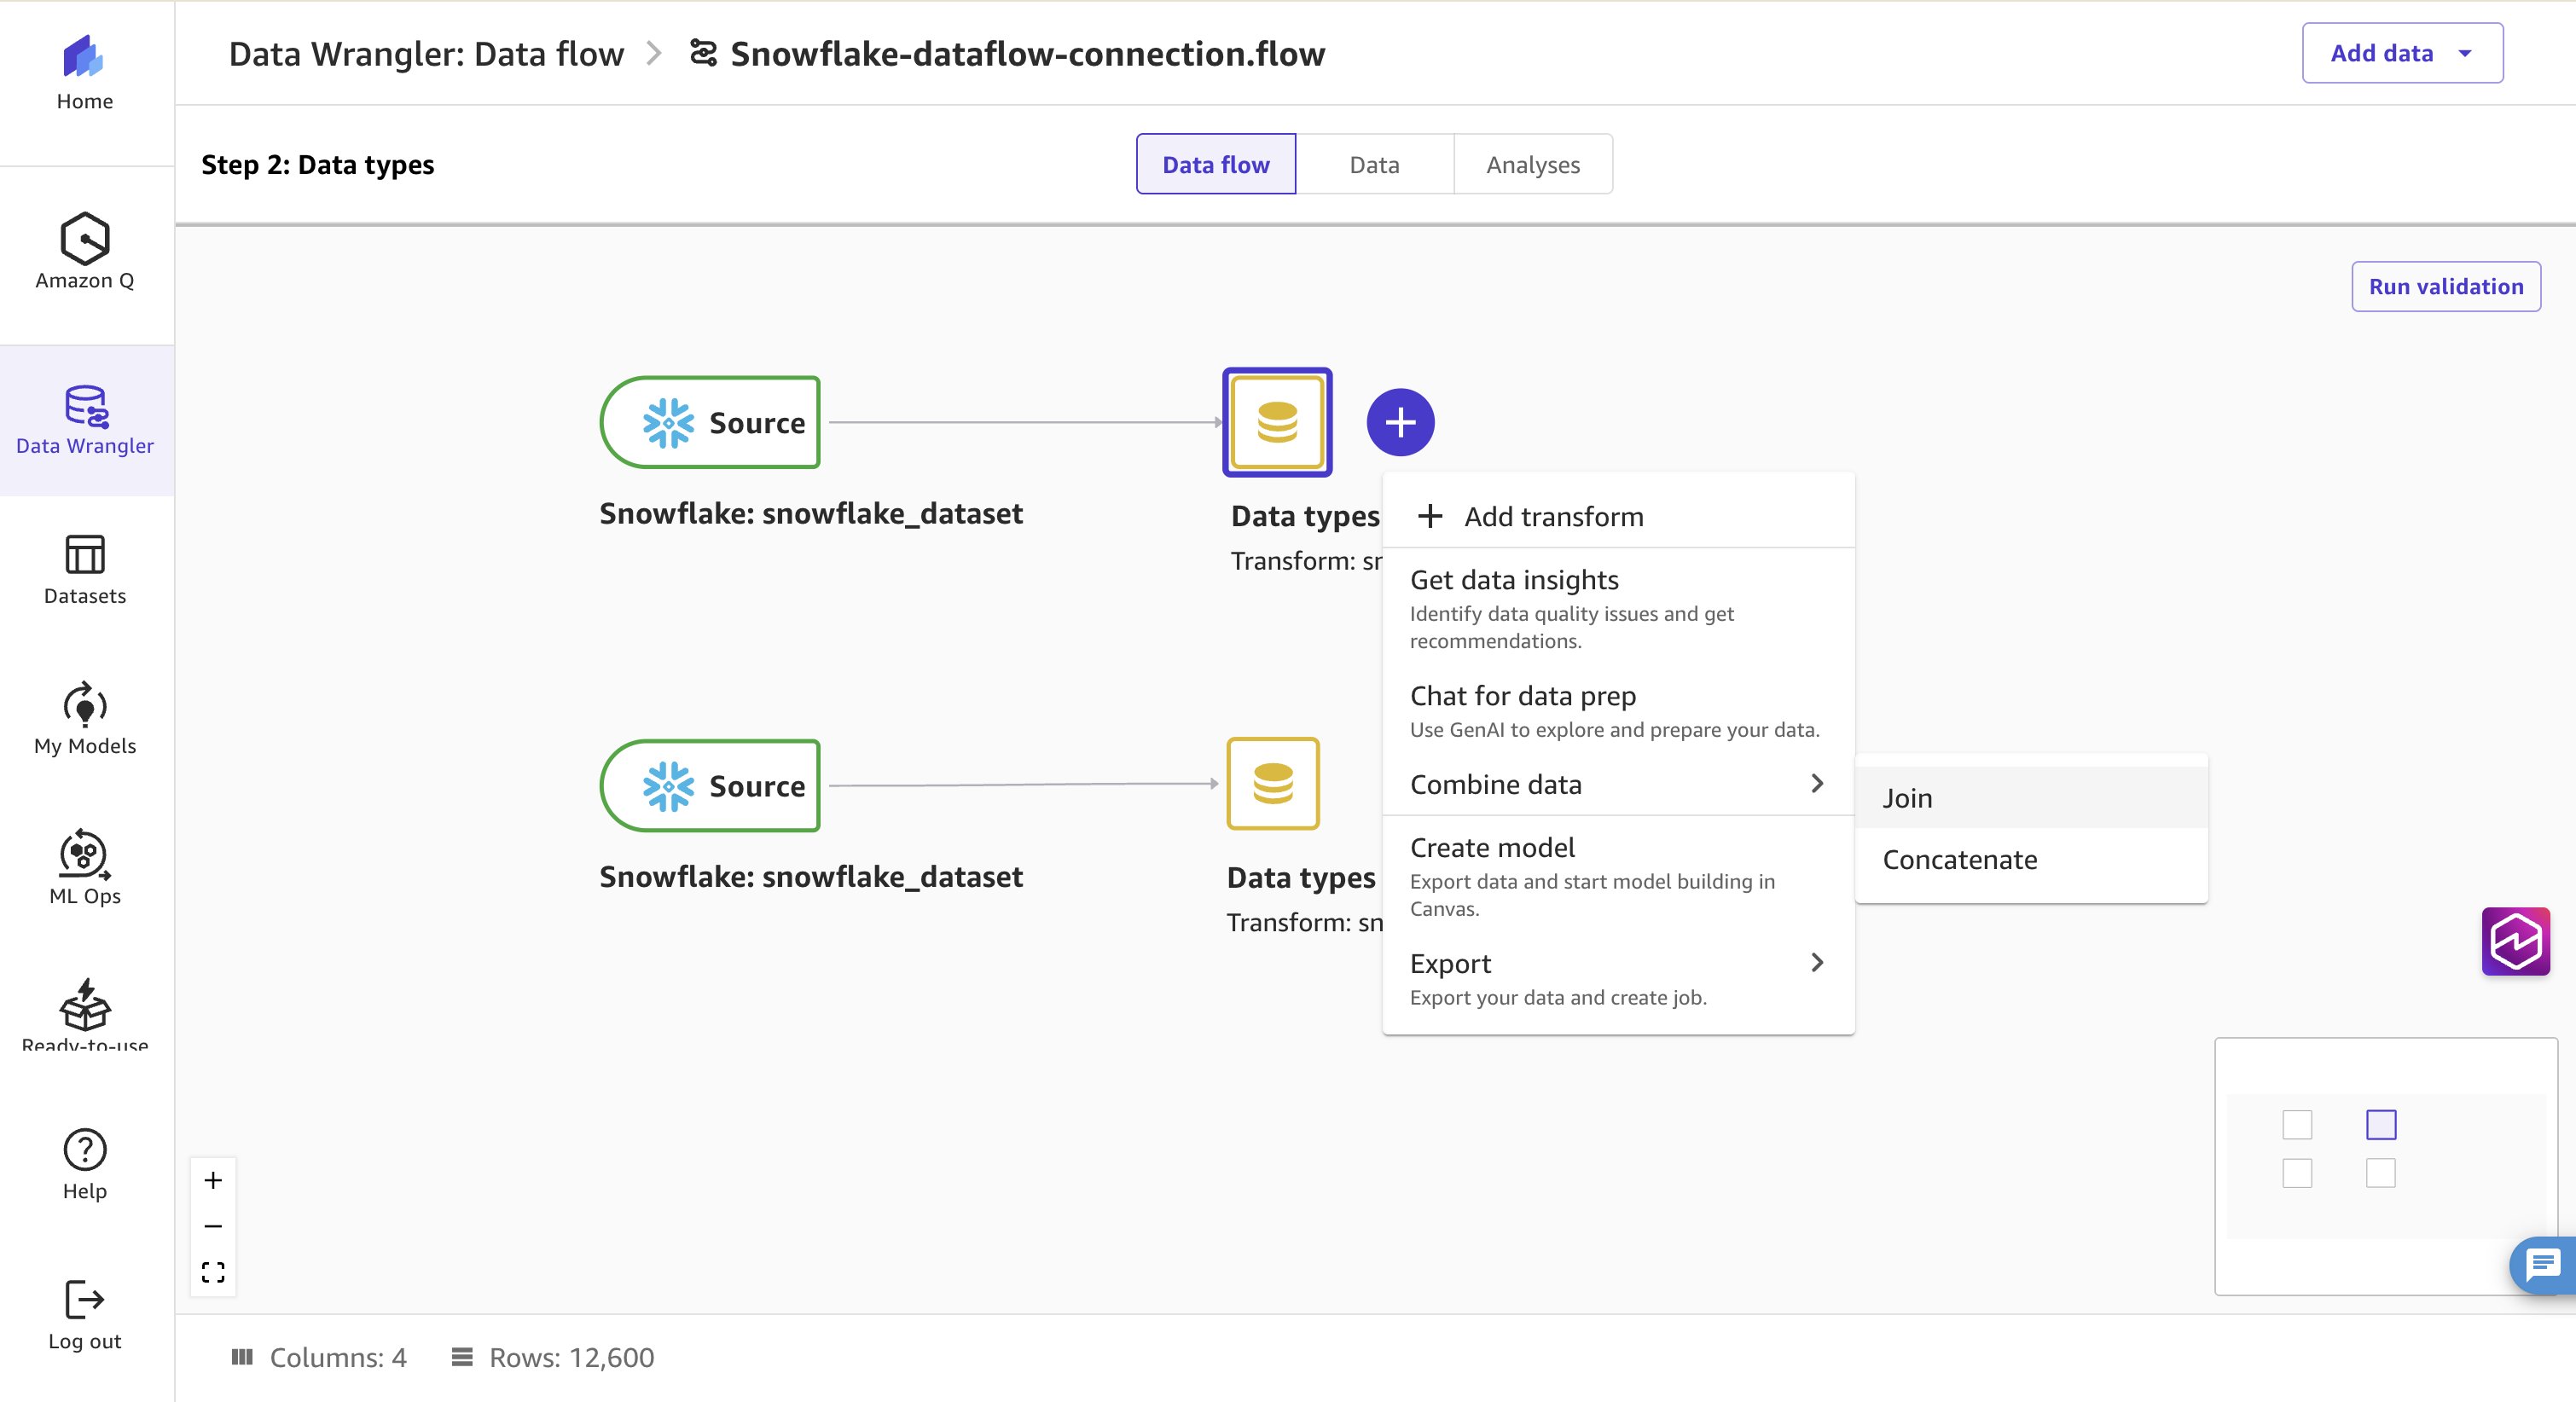
- 在 Data flow 屏幕上,您会看到从 Snowflake 导入的两个数据源。选择第一个数据类型,并点击其旁边的加号图标。选择 Combine data,然后选择 Join。当右侧面板打开时,从数据流中选择第二个数据类型进行连接。
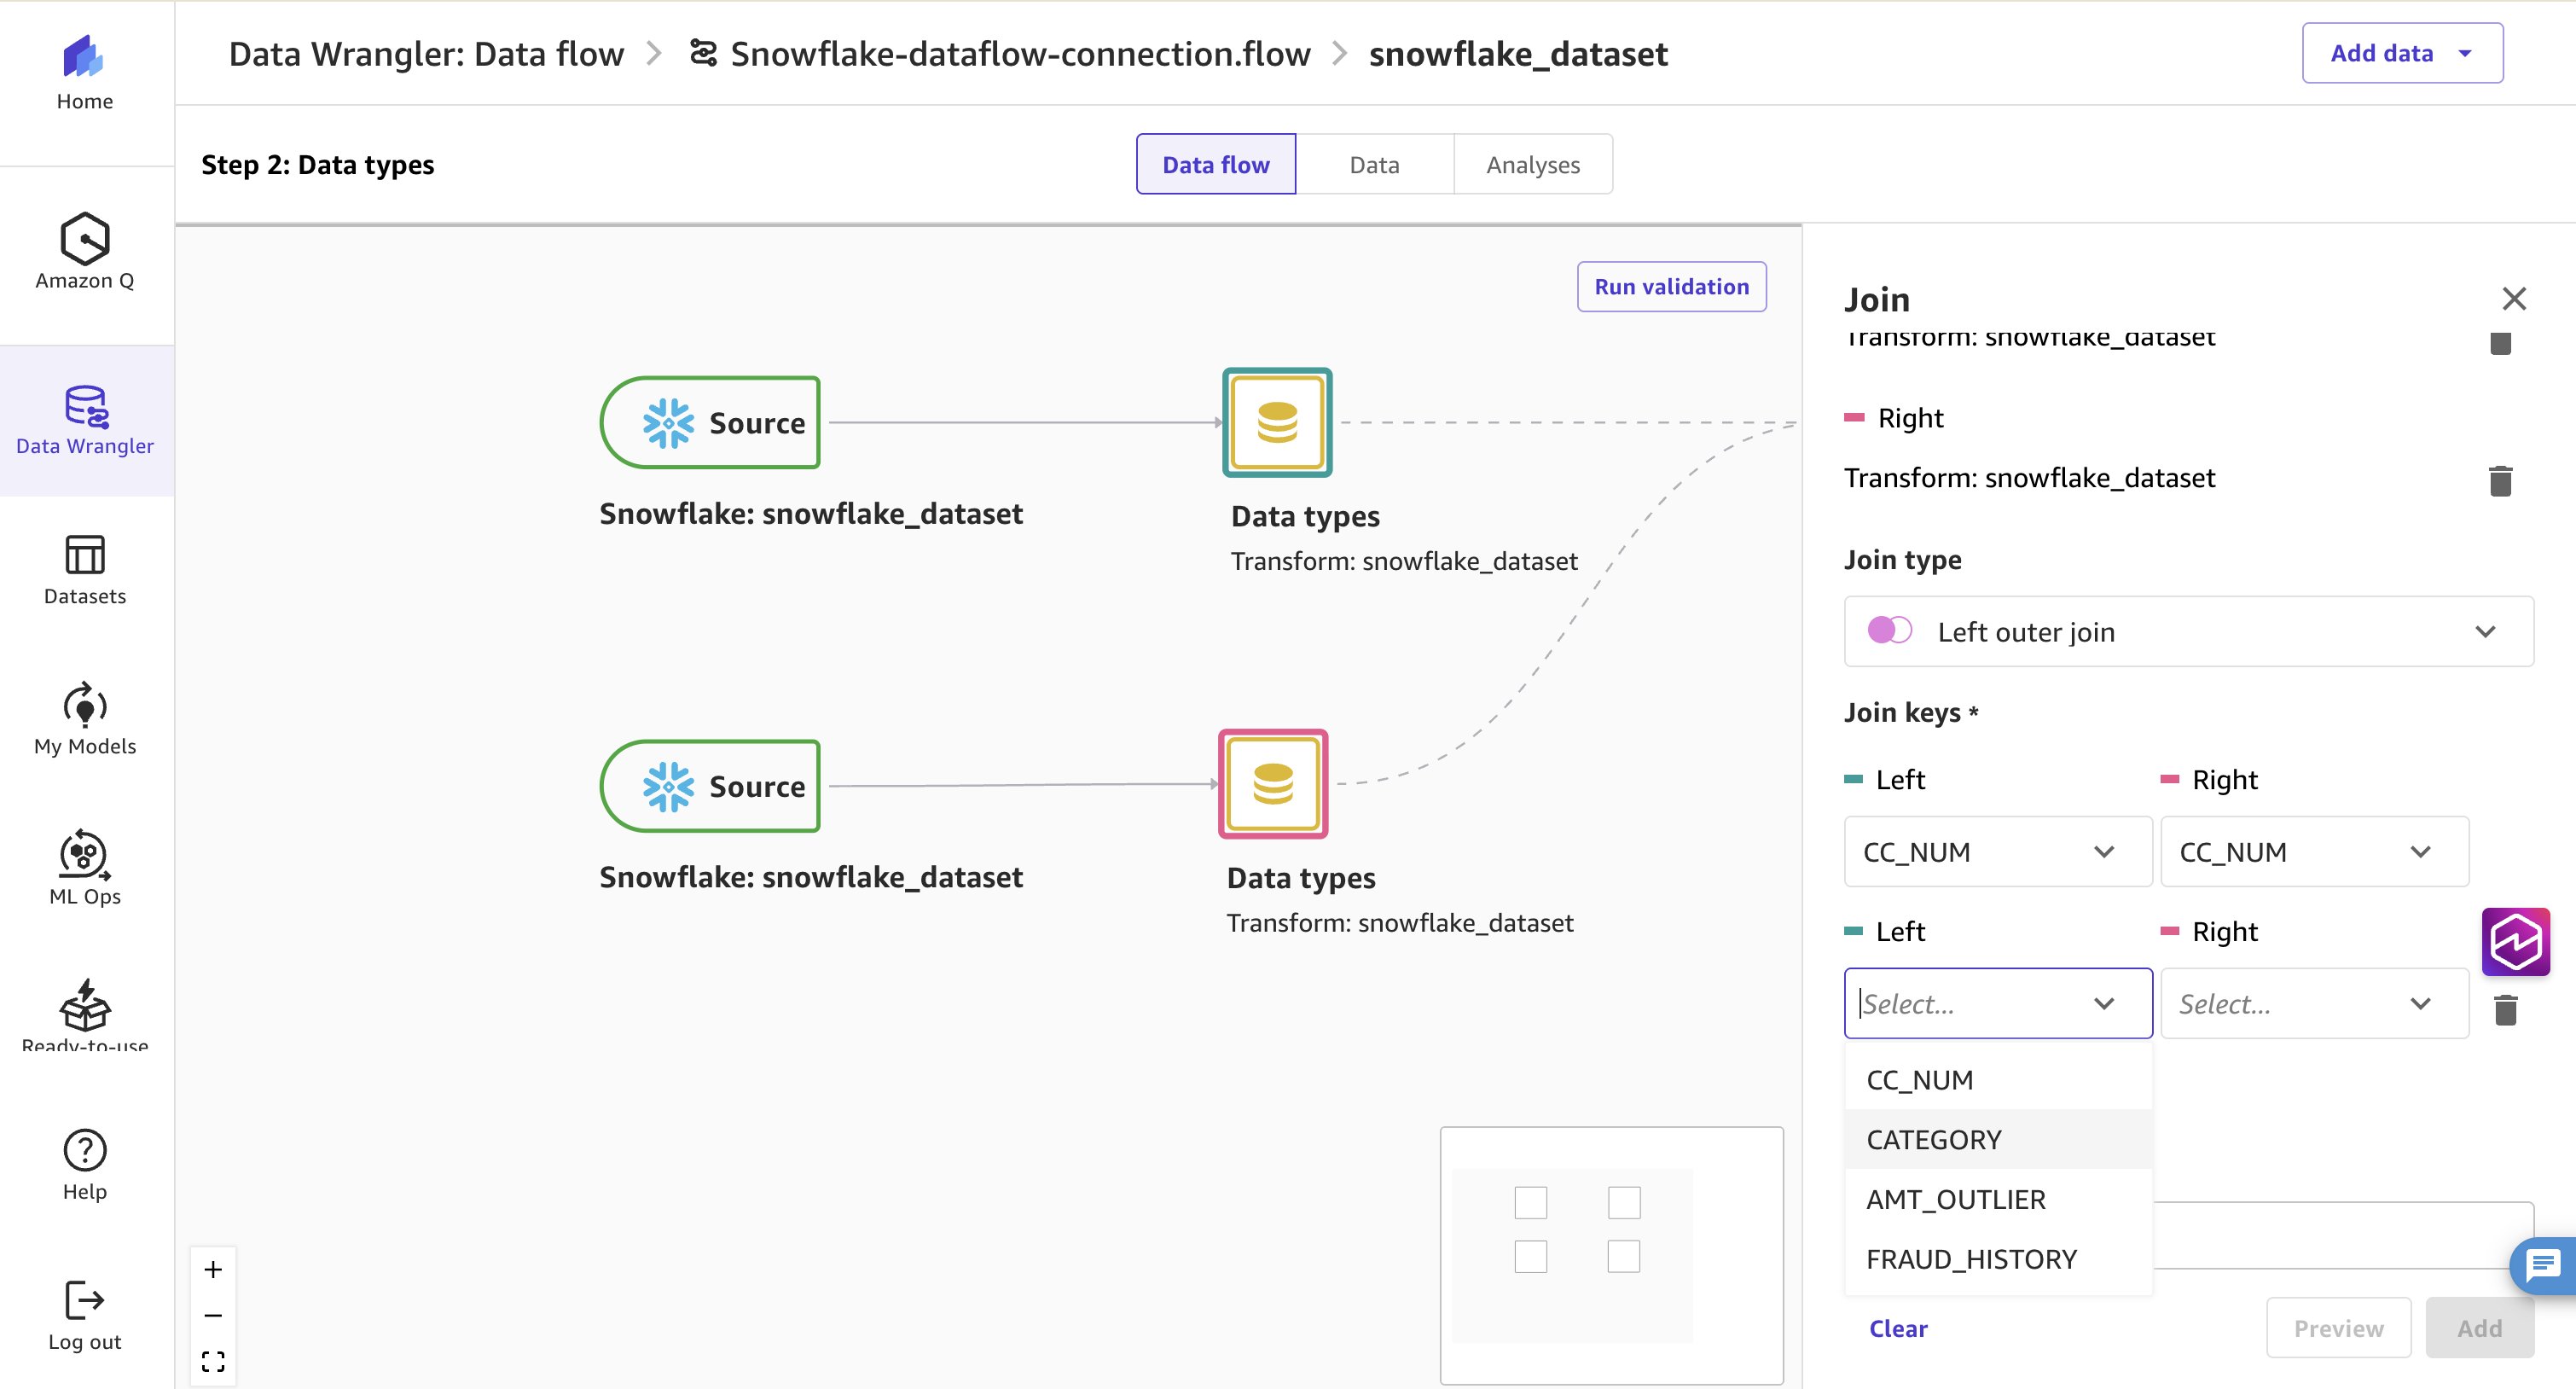
- 选择 Left outer join 作为连接类型。添加一个连接键,并选择 Category 作为左右连接键。
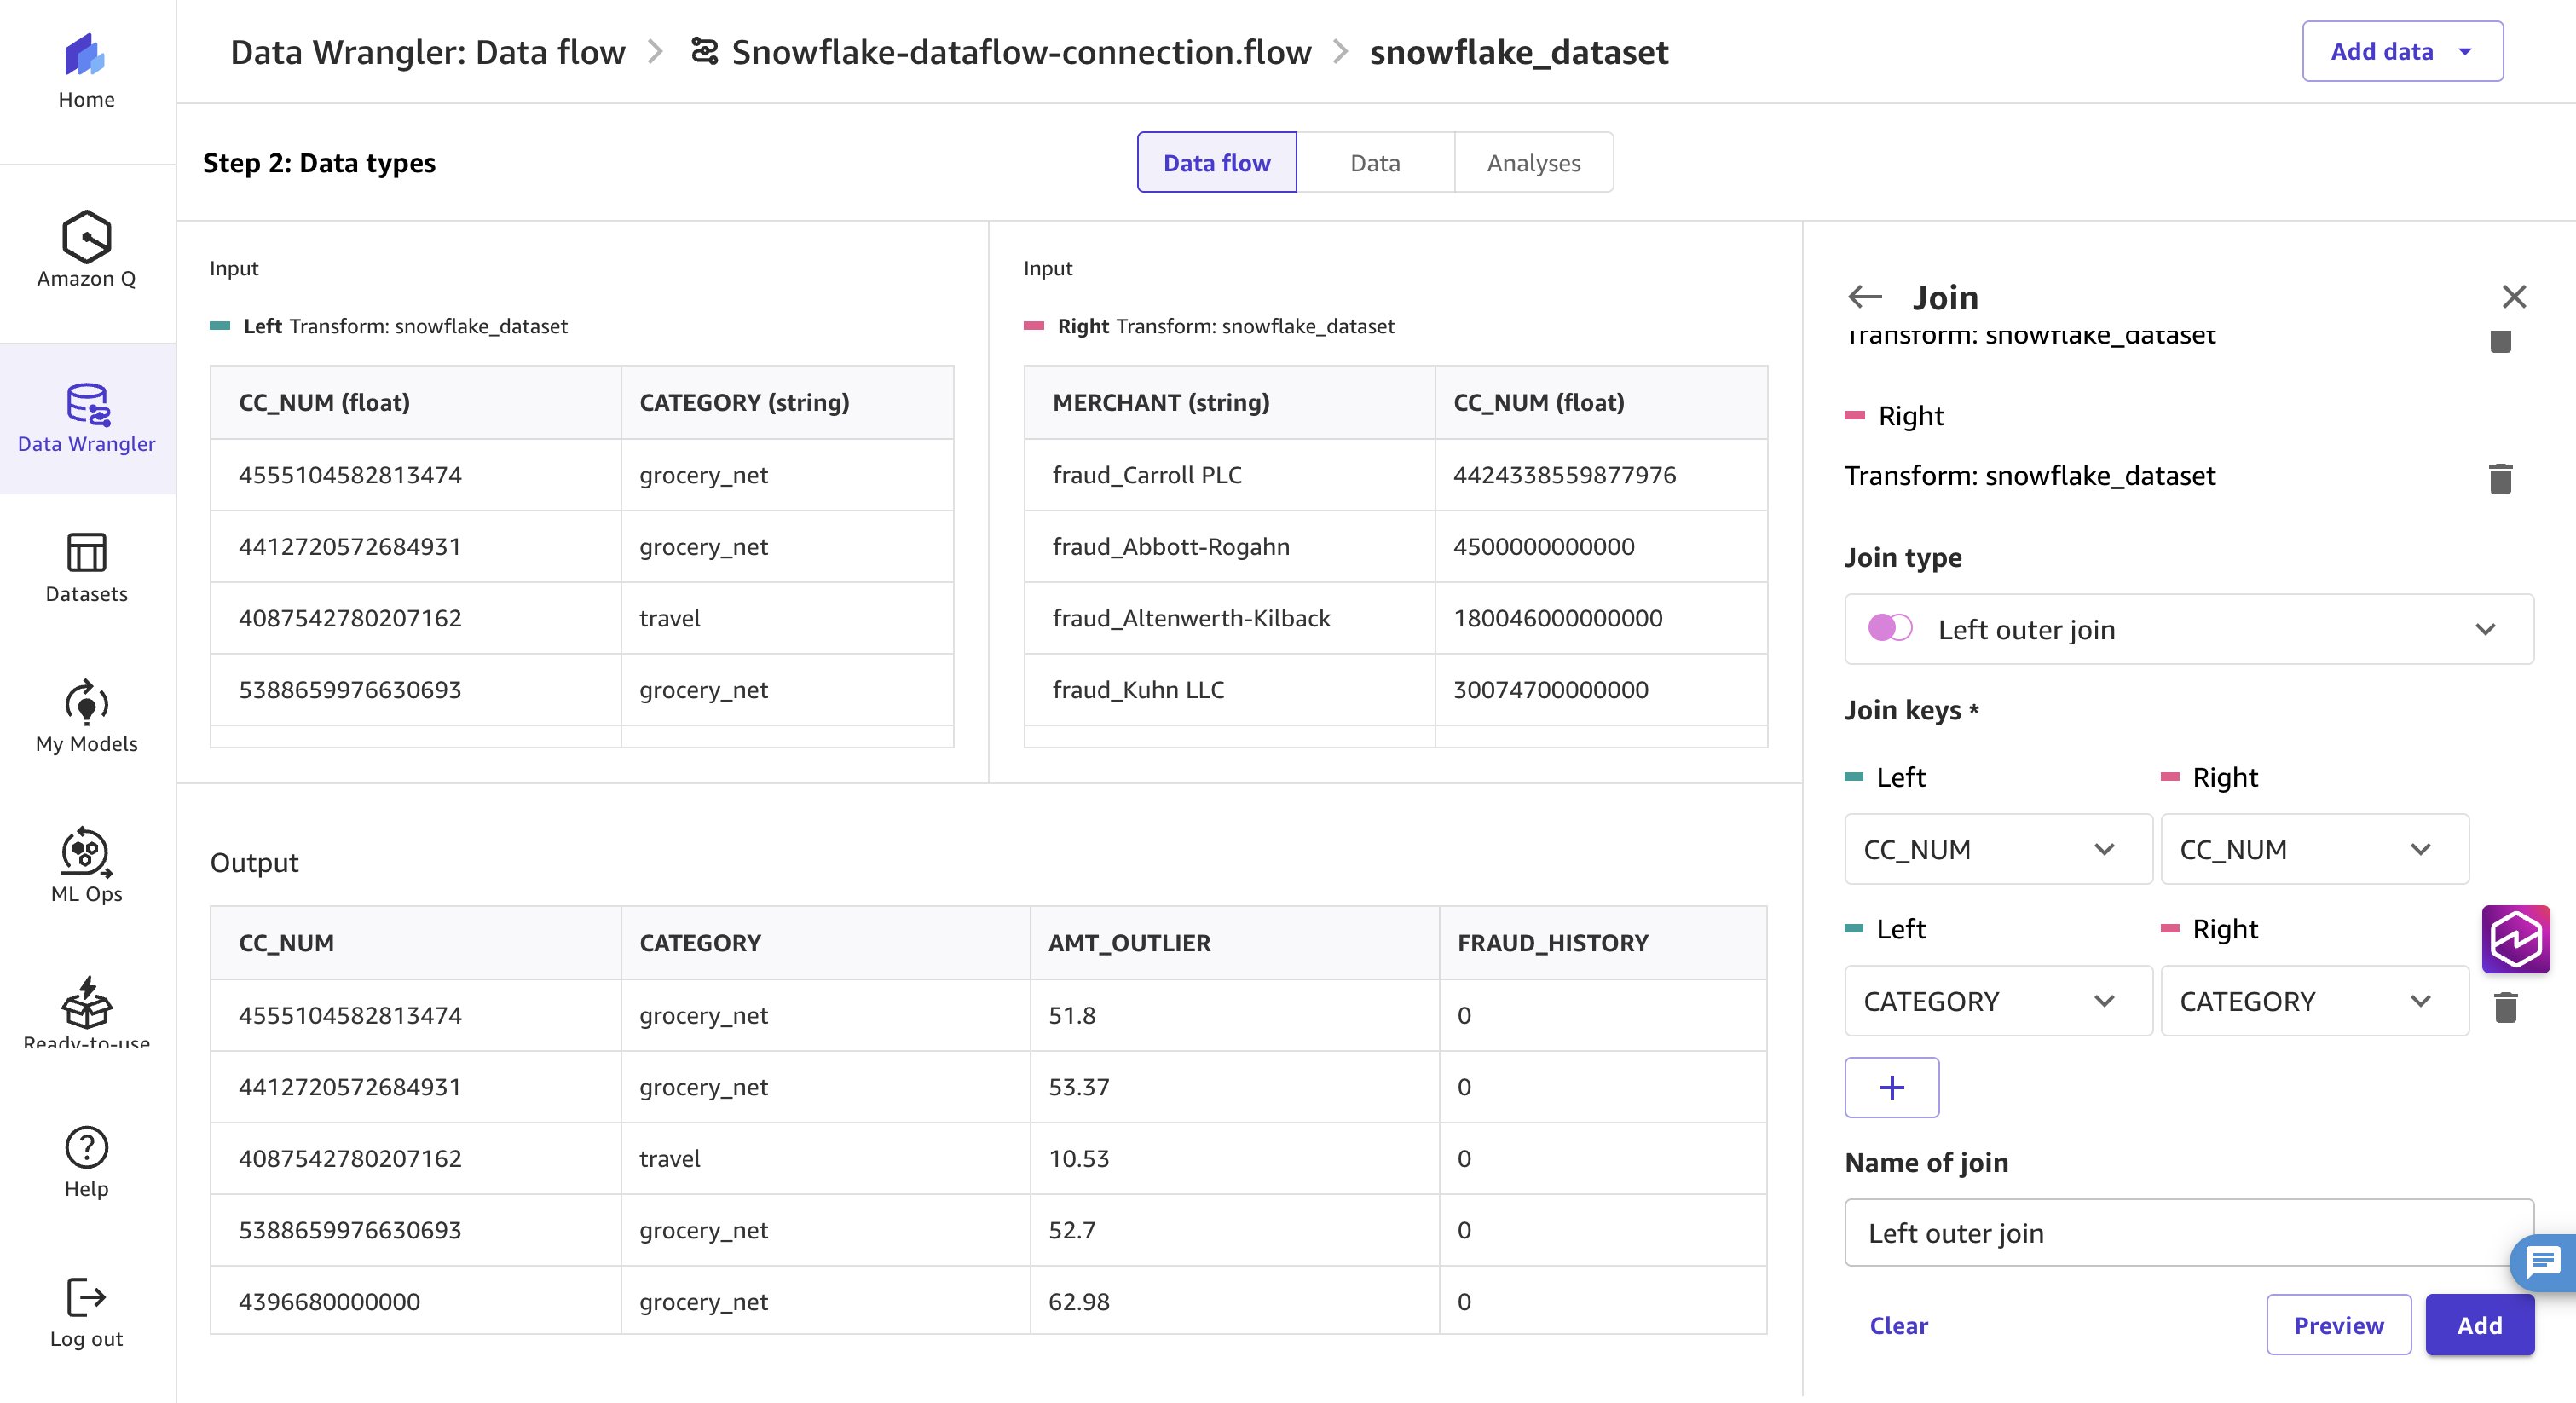
- 选择 Preview 查看连接后的数据。选择 Add 继续。
接下来,您将创建离群值特征并移除敏感列。
- 返回 Data flow 屏幕,选择连接,点击其旁边的加号(+),然后选择 Add transform。
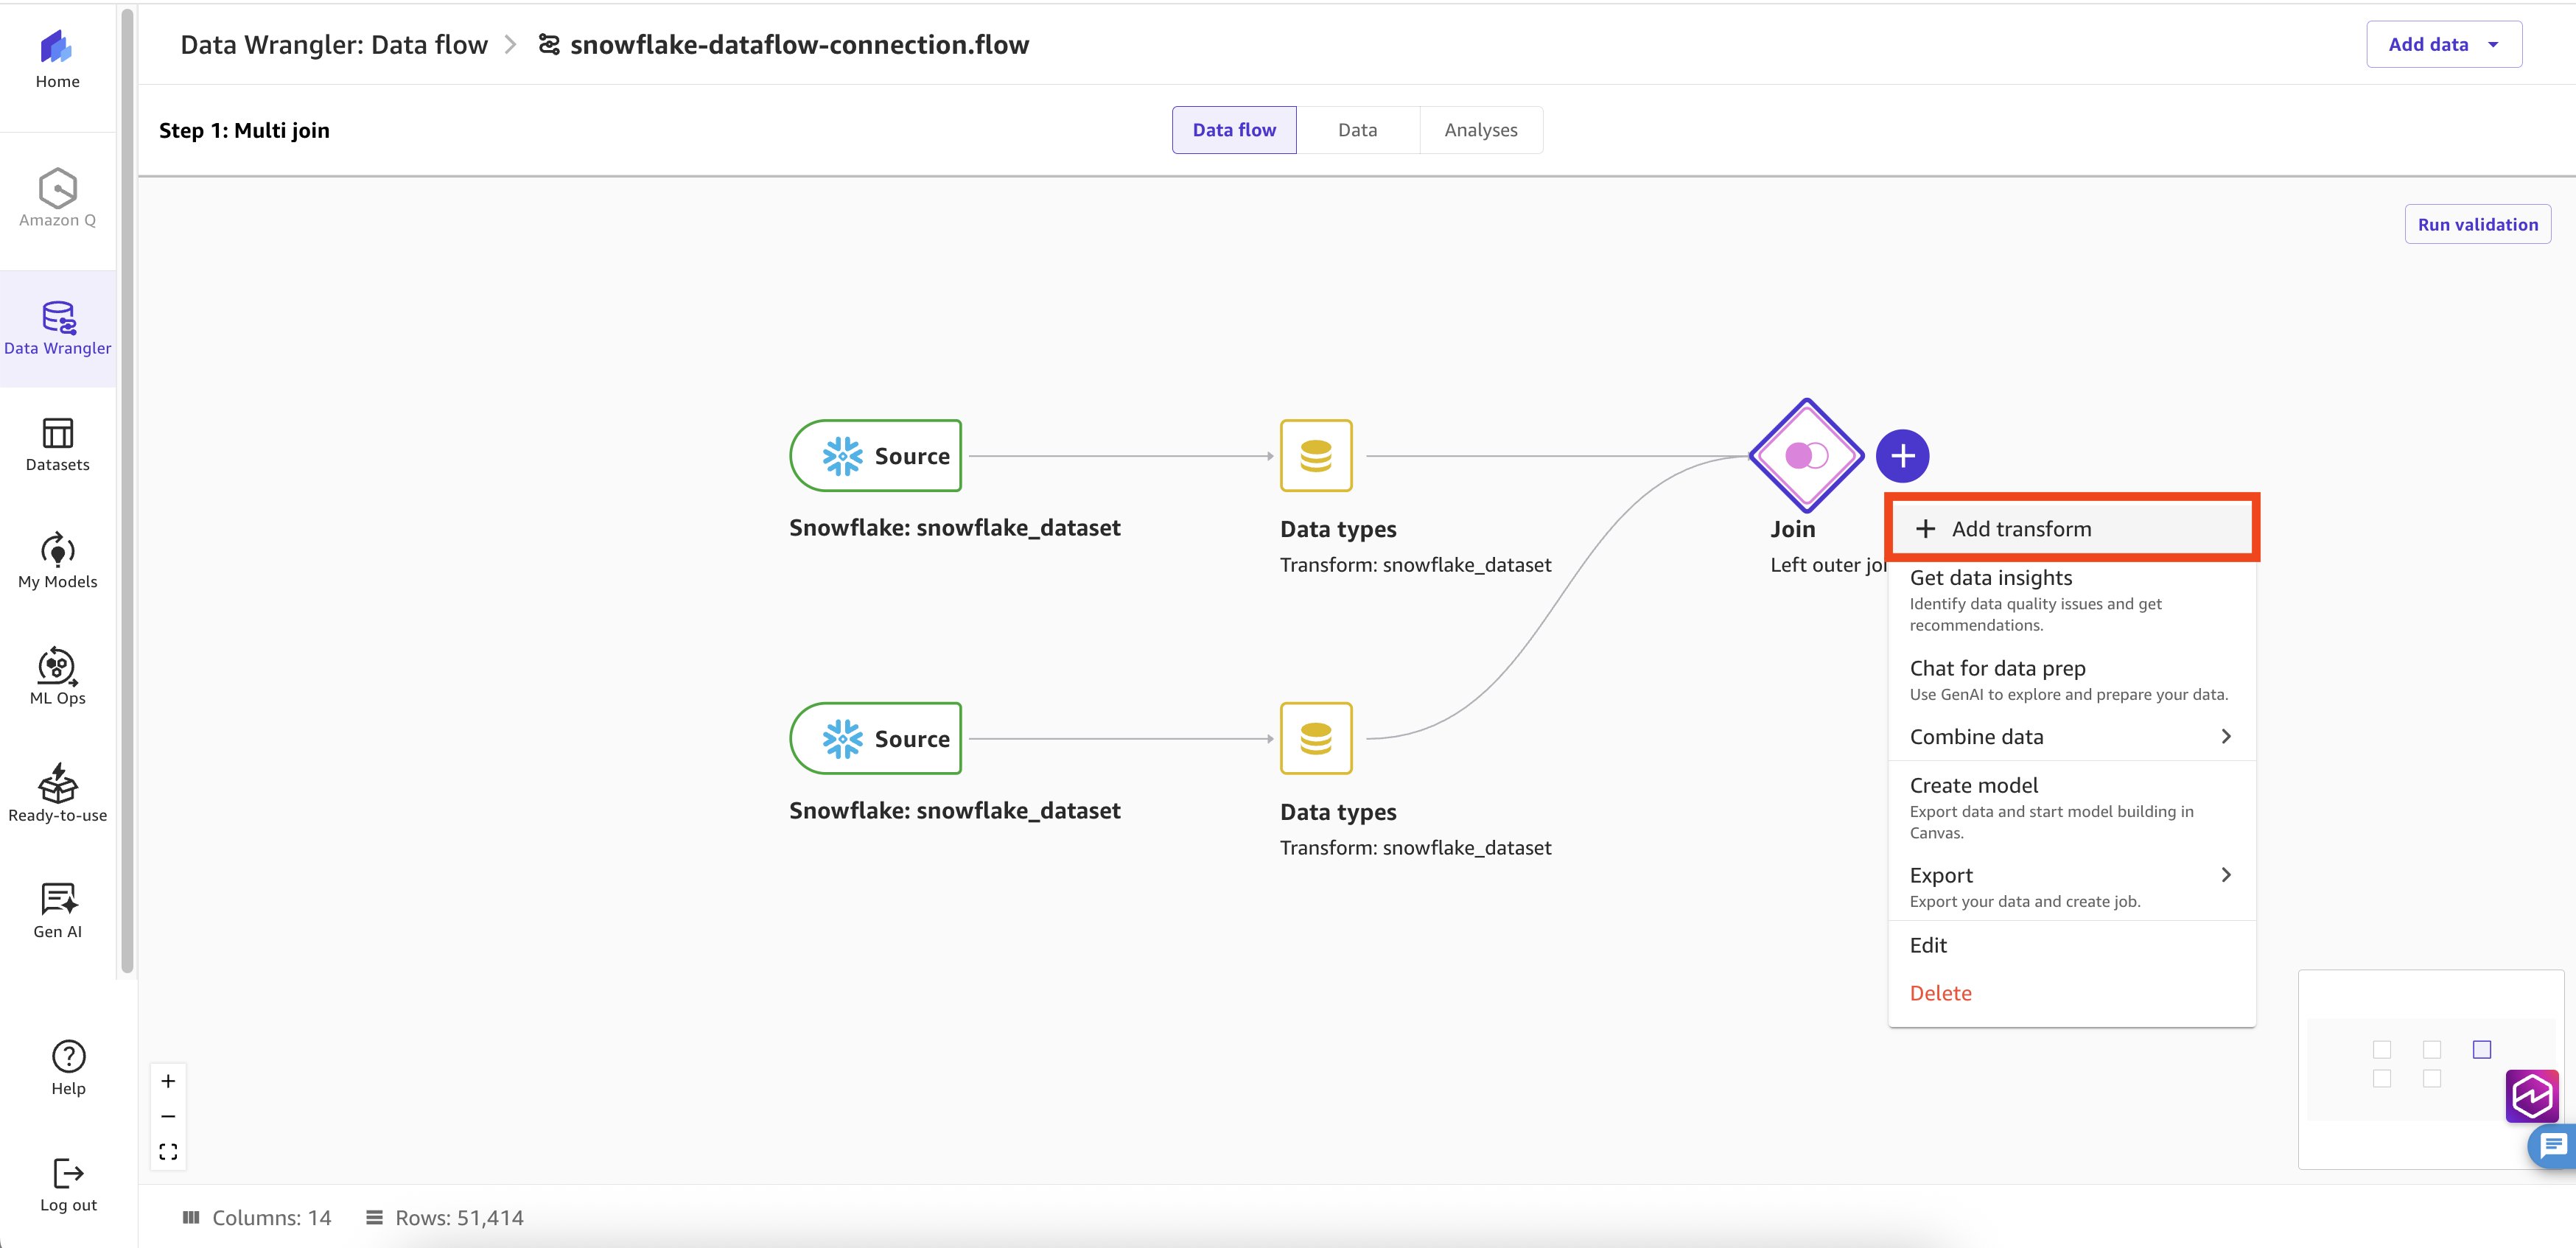
- 界面打开后,在右侧面板中选择 Add transform,然后选择 Custom Formula。
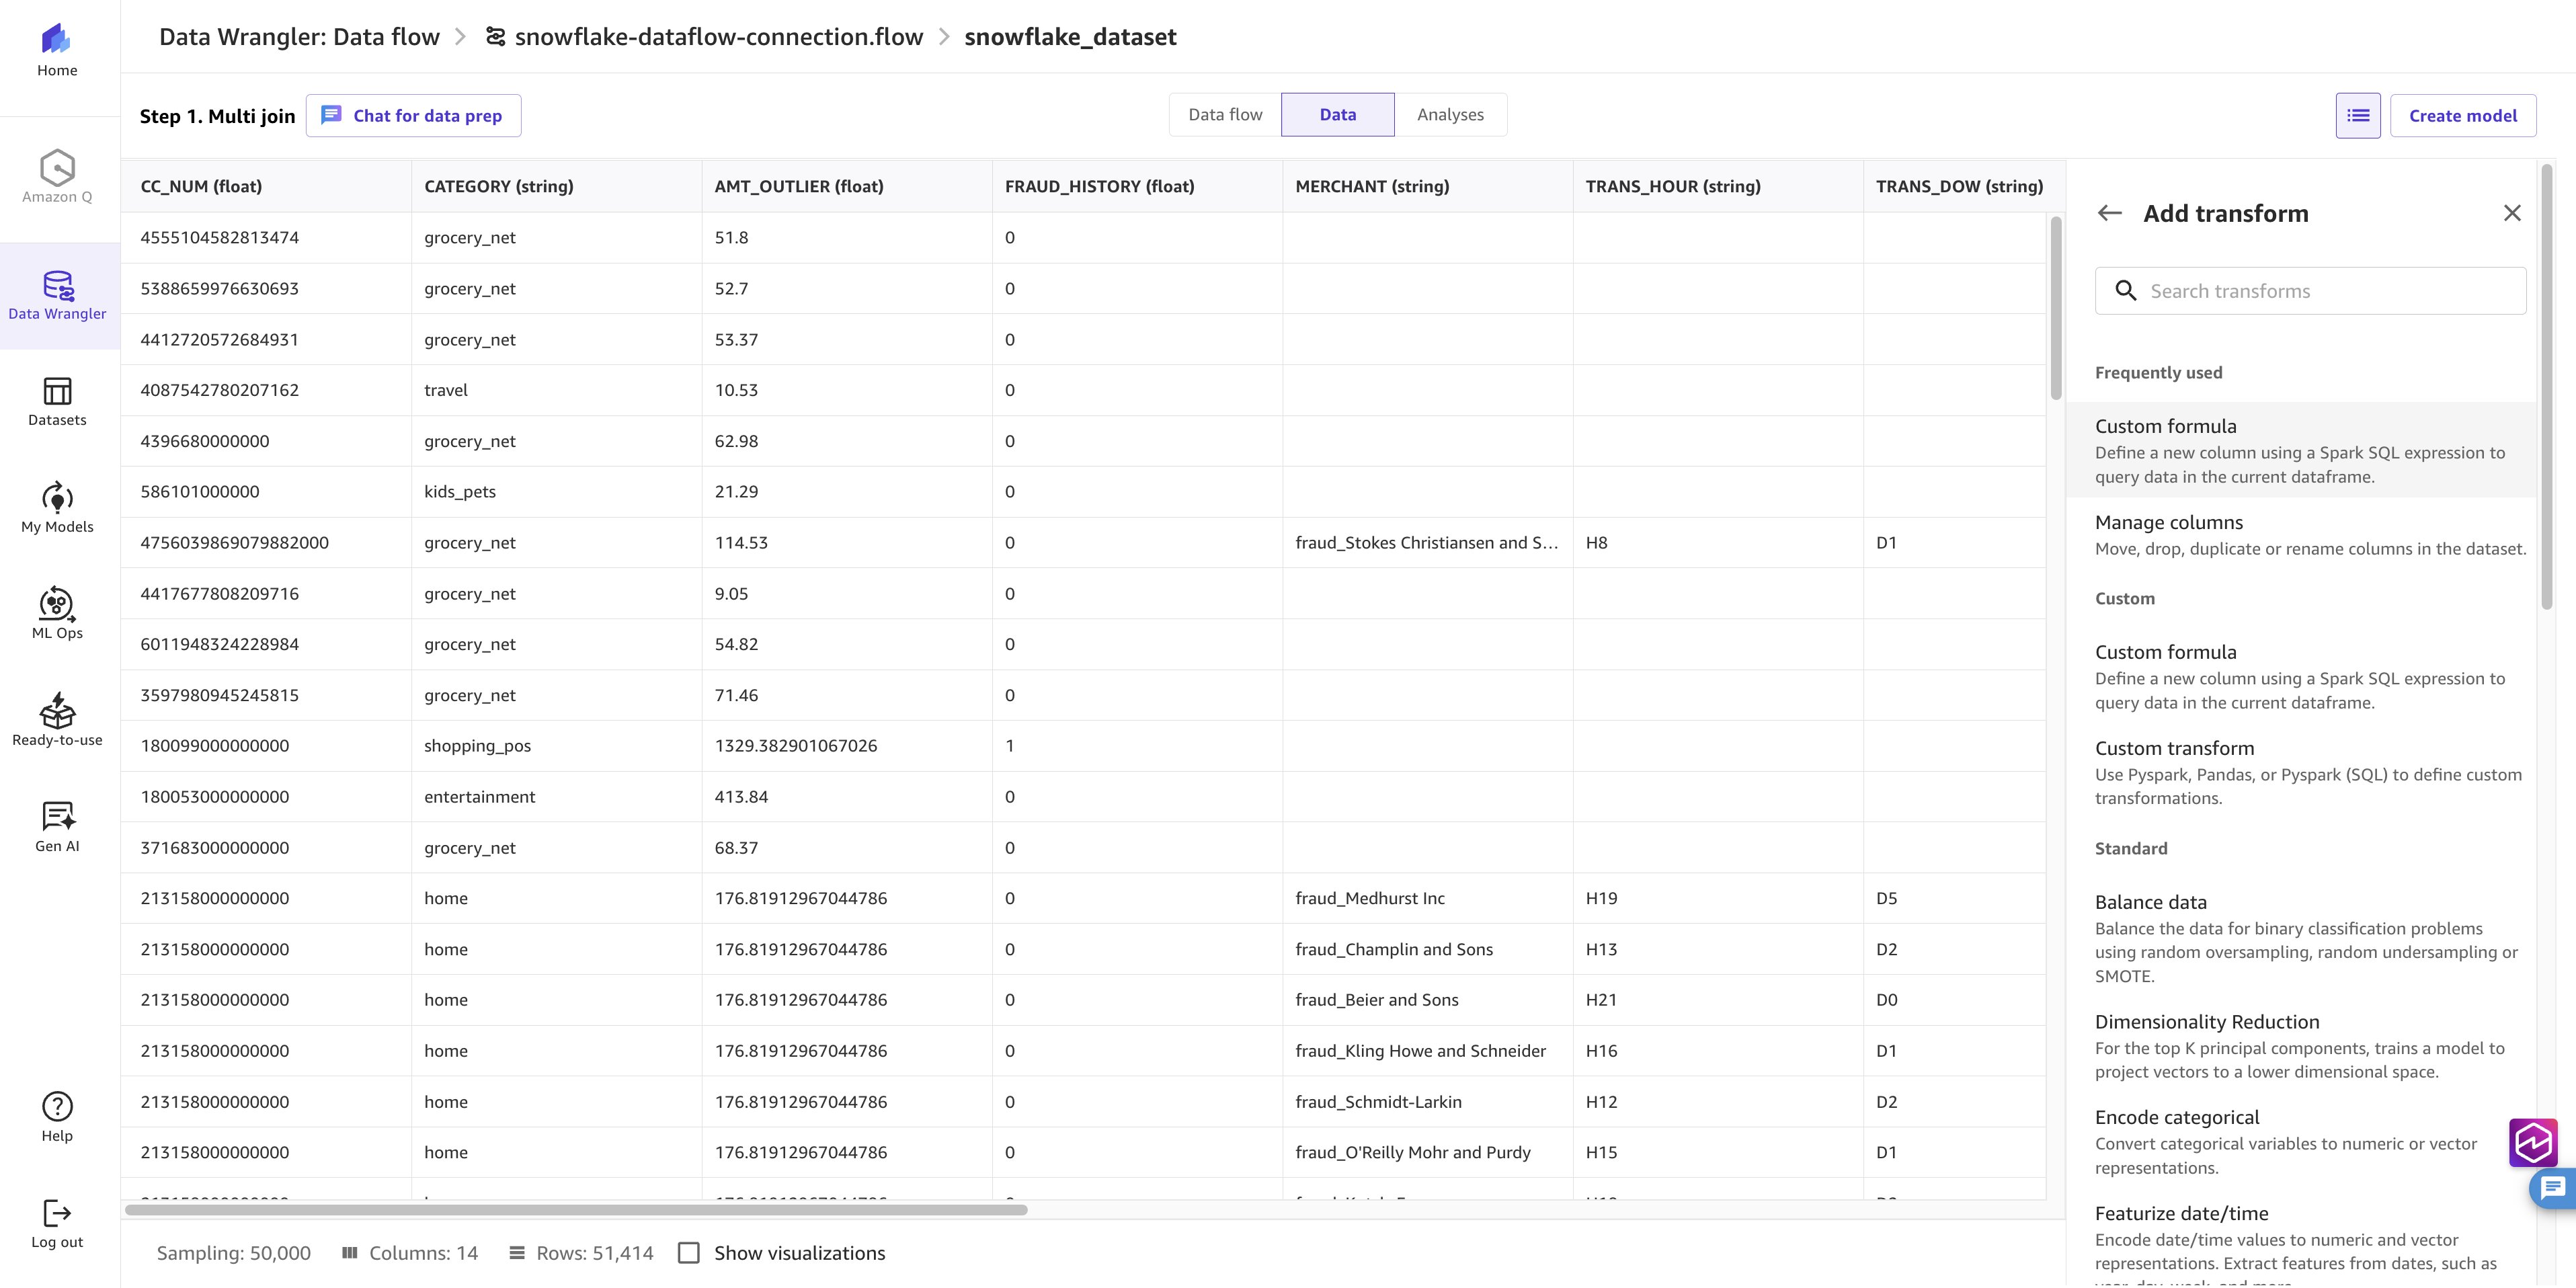
- 此选项让您可以使用 Spark SQL 表达式灵活地添加列。在 Home 选项卡中复制并粘贴以下公式。将输出列命名为 CC_FLAG,然后选择 Add。
CASE WHEN AMT > AMT_OUTLIER THEN 1 ELSE 0 END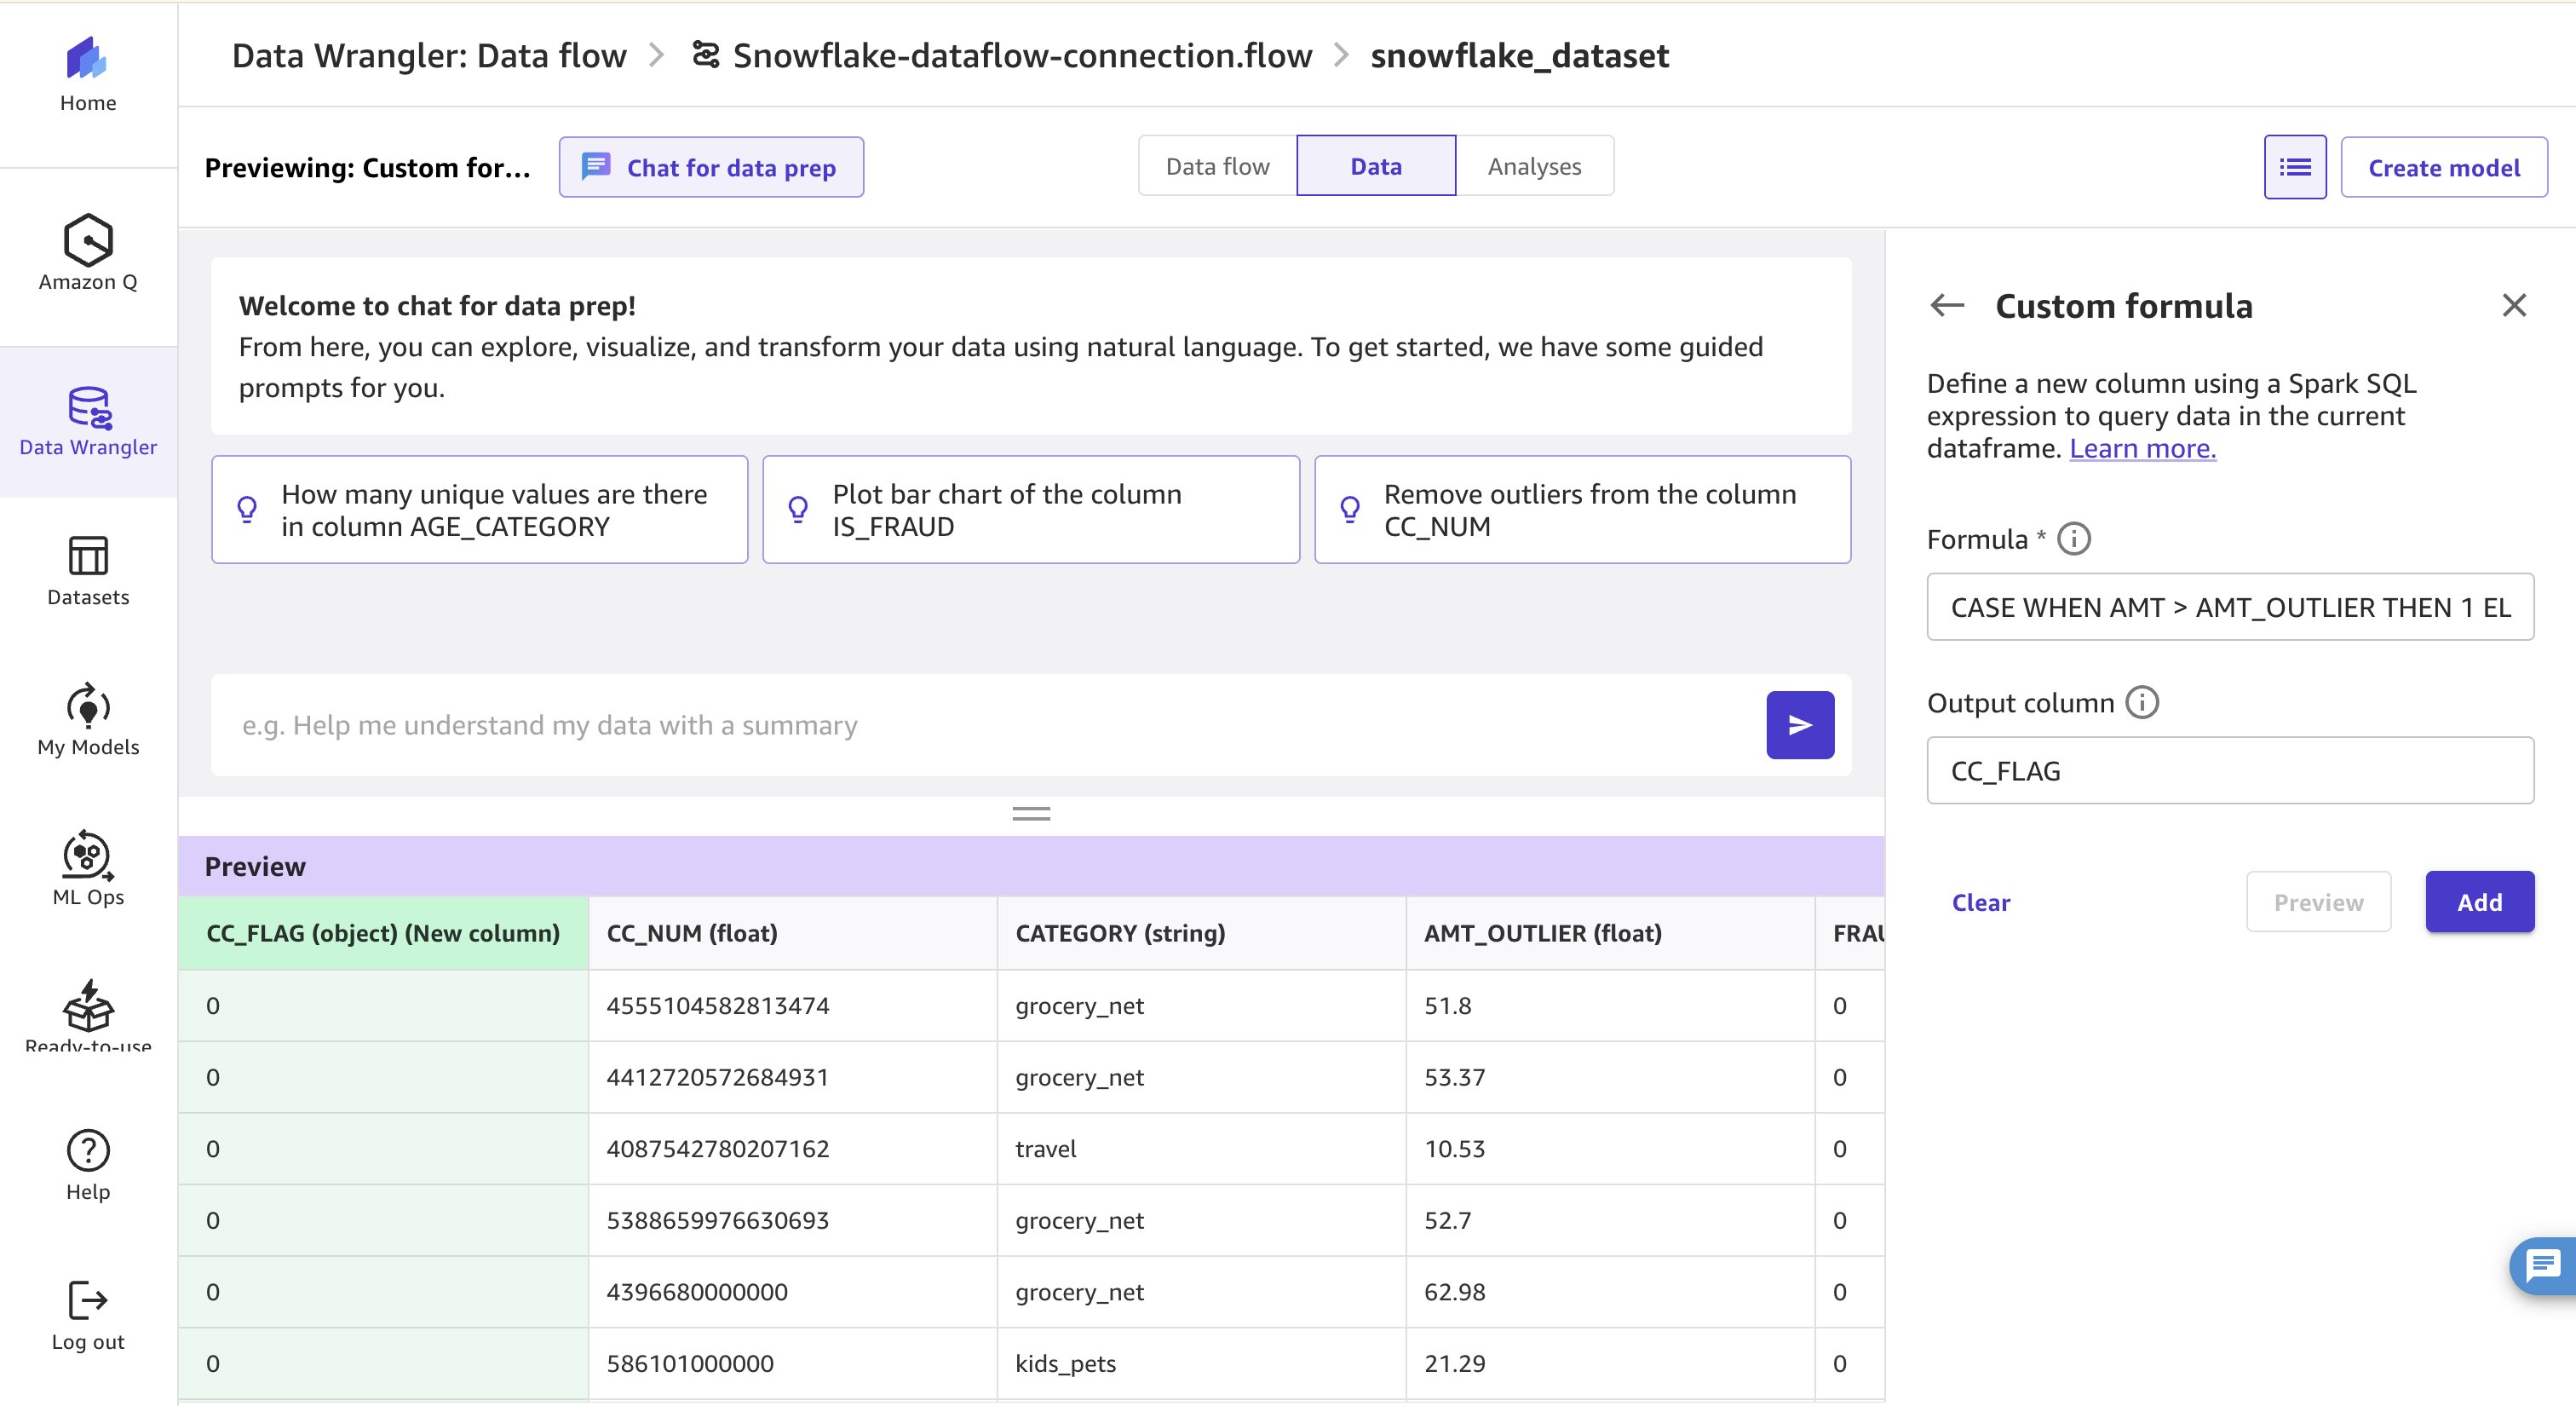
- 要添加另一列,请重复相同步骤输入自定义公式,然后复制并粘贴以下查询,并将输出列命名为 MERCHANT_AMT_FLAG。
CASE WHEN AMT > MERCHANT_AMT_OUTLIER THEN 1 ELSE 0 END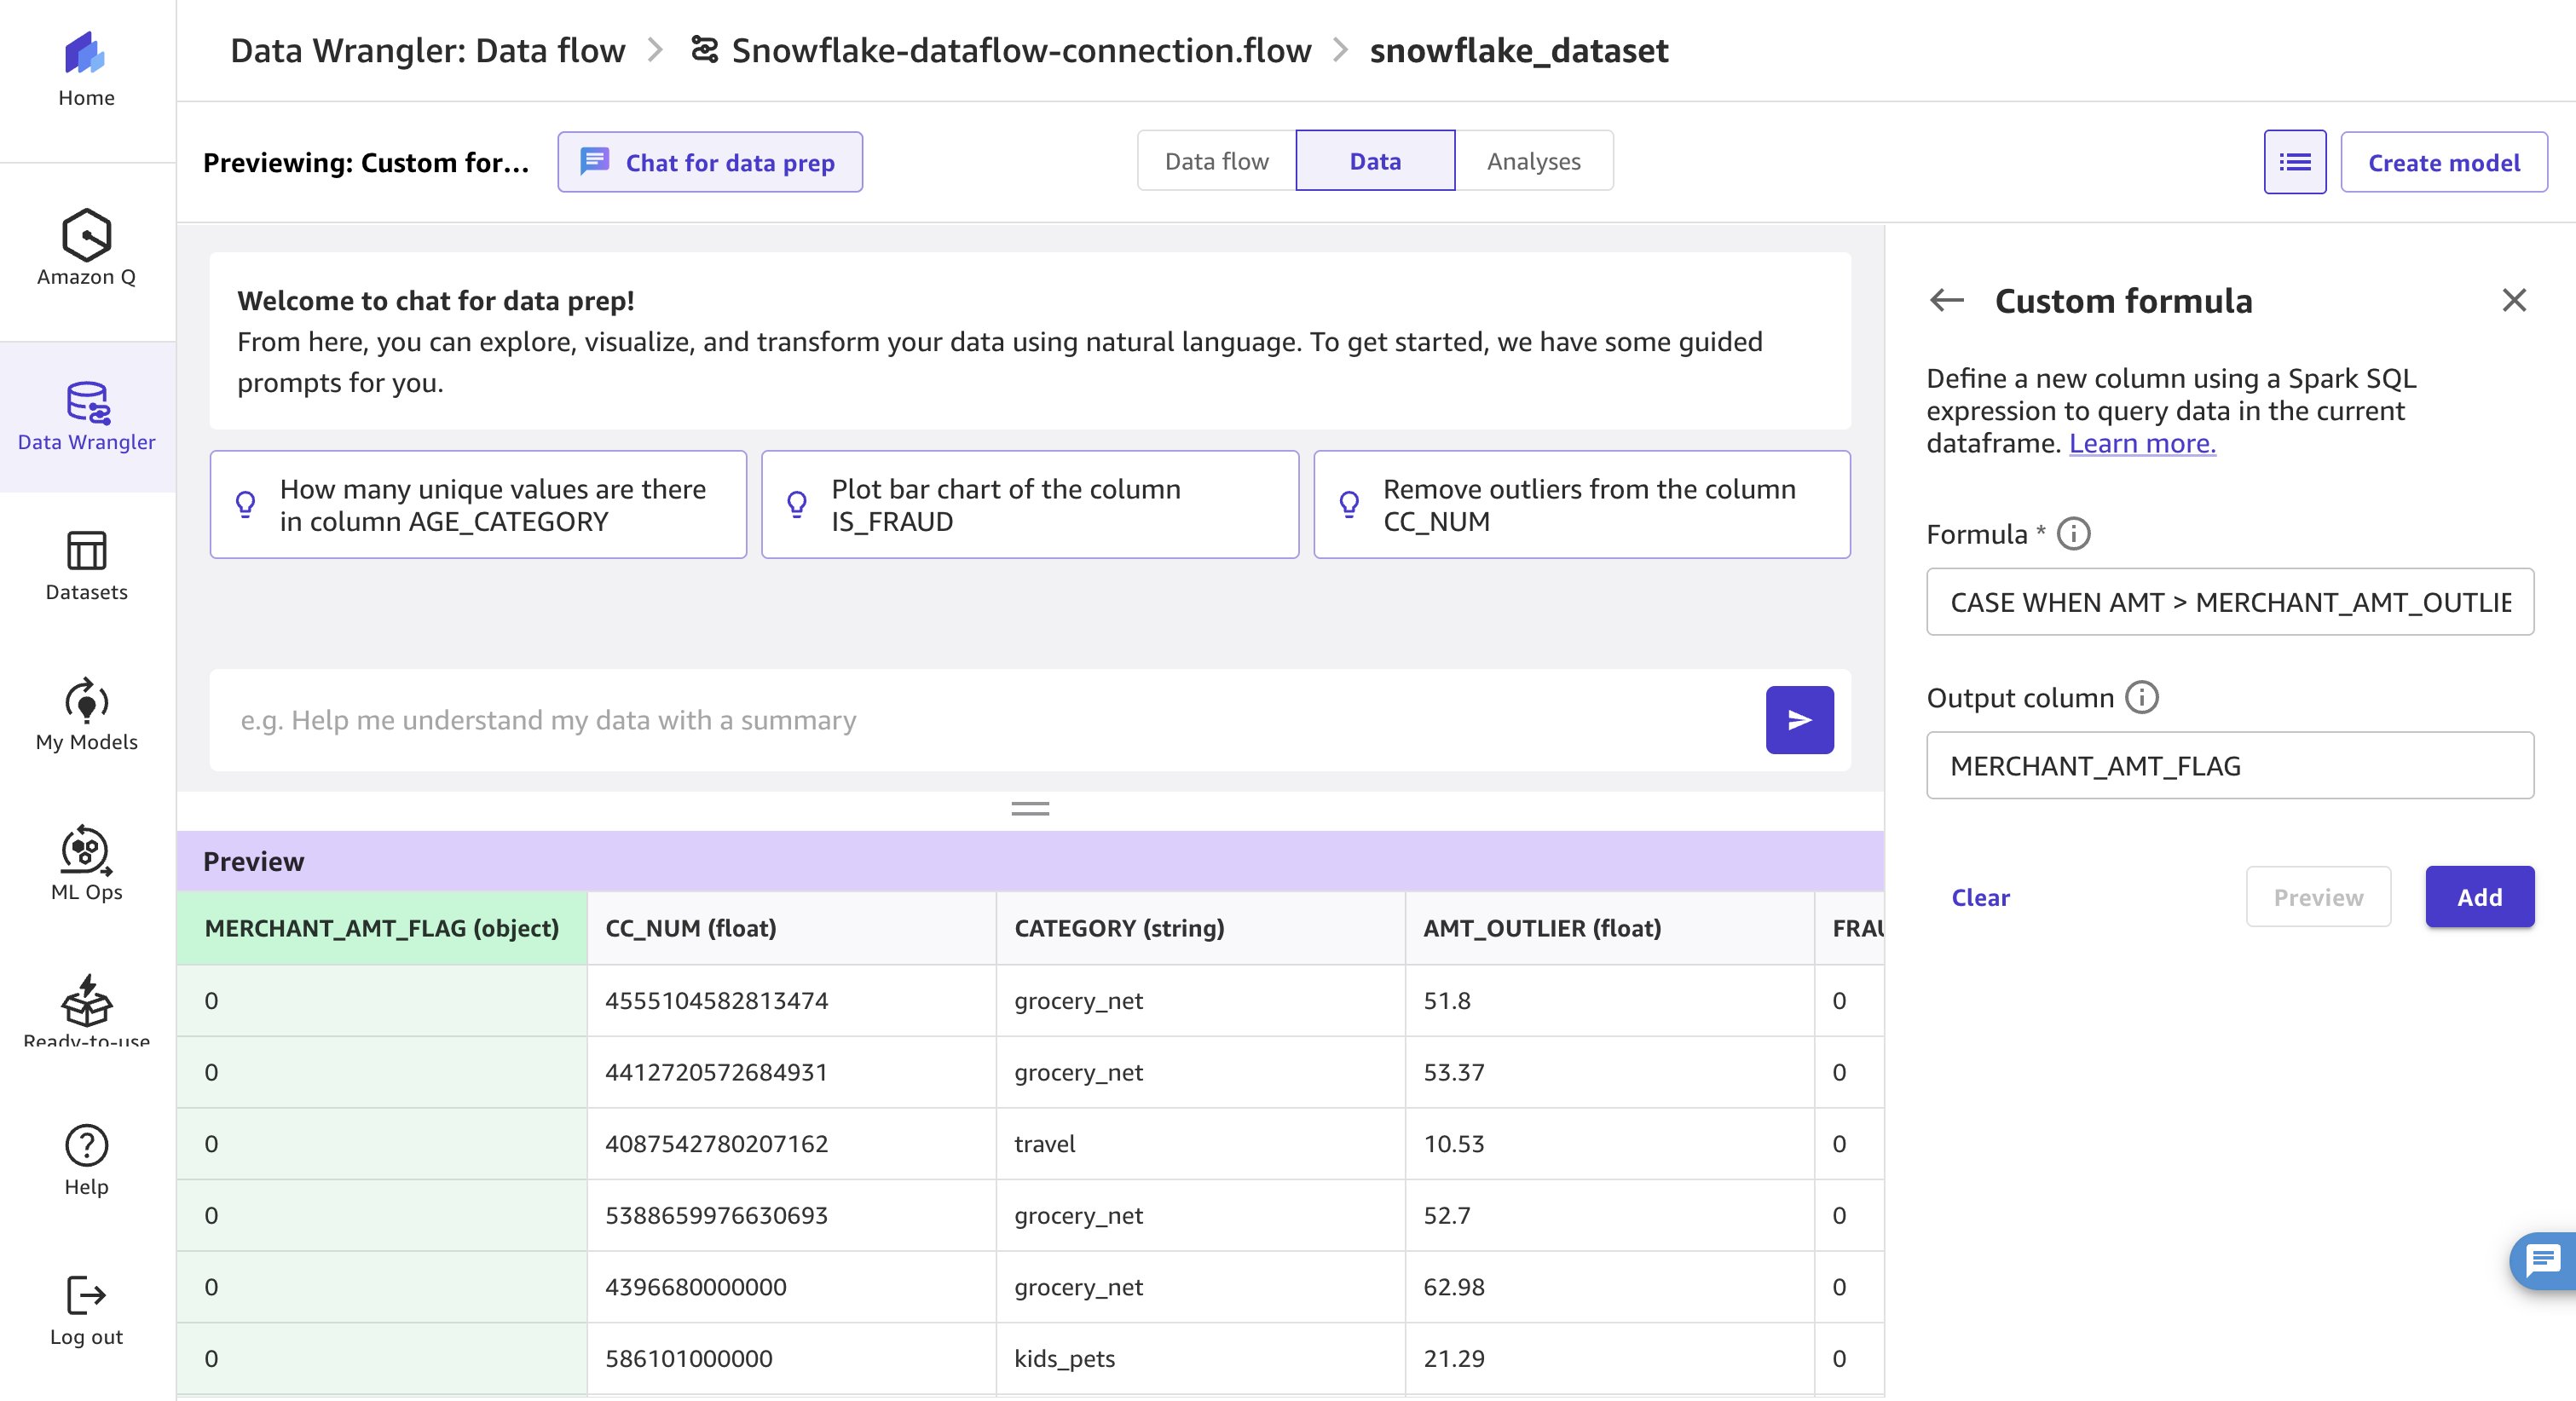
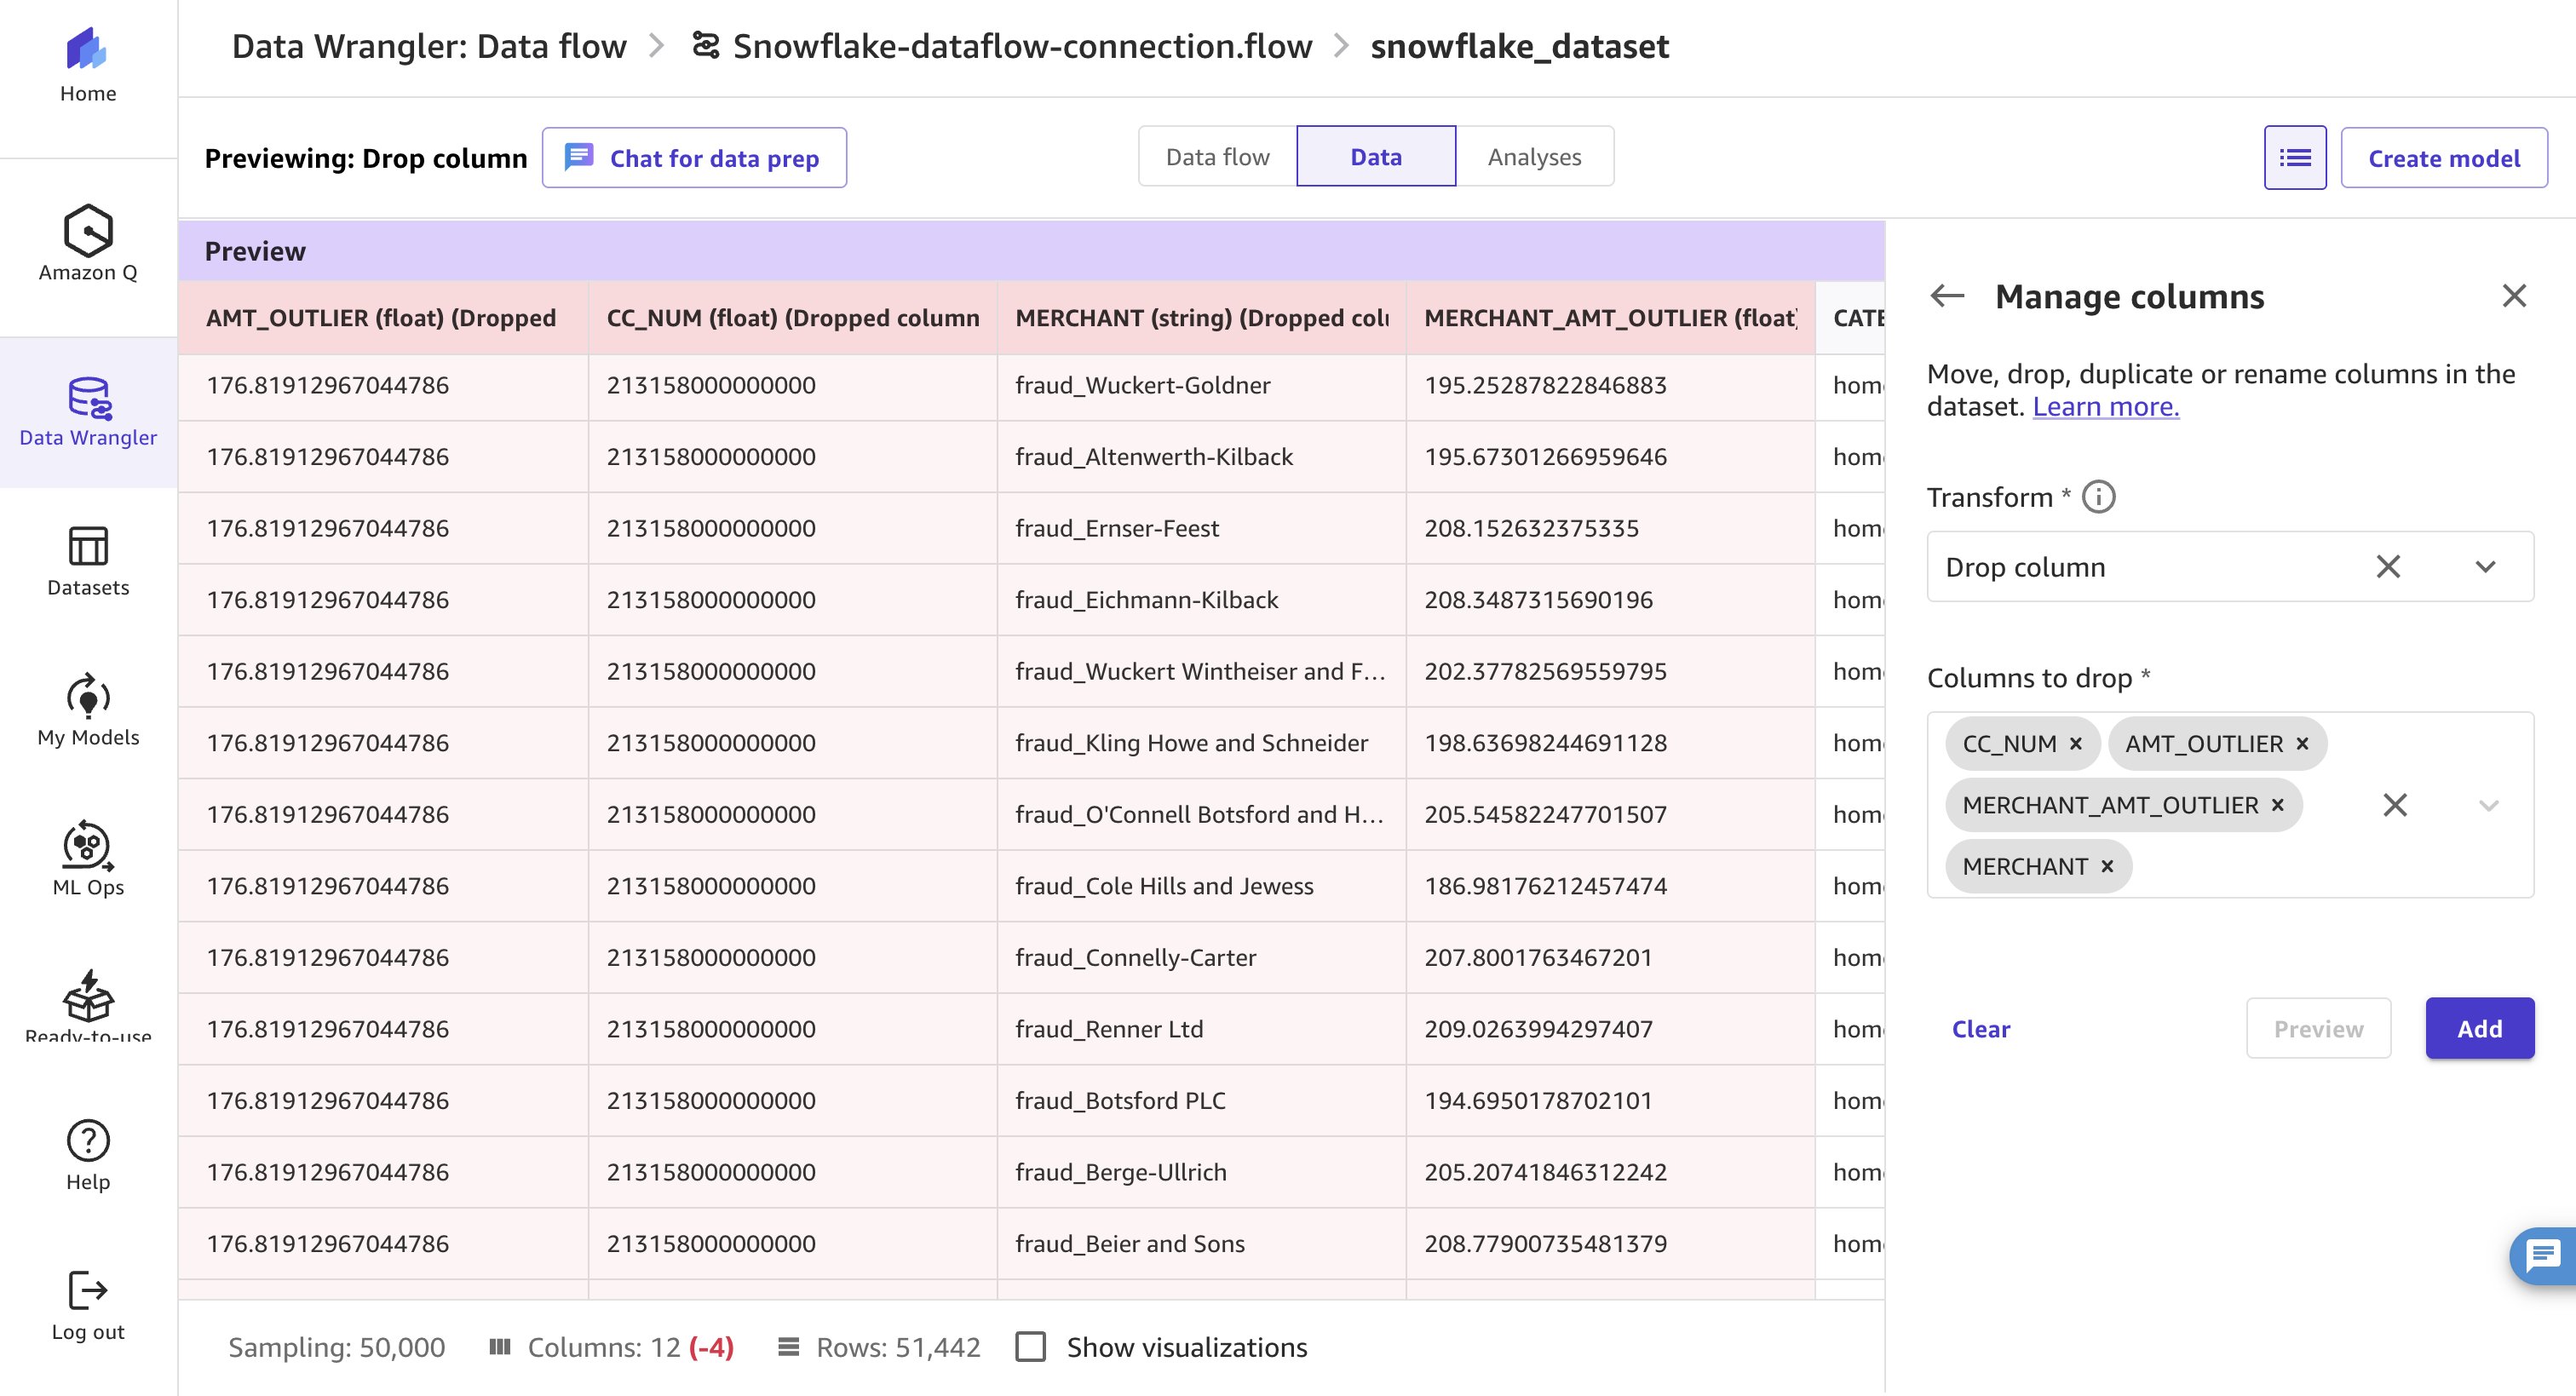
- 为确保模型不包含敏感信息(如卡号、商户名称以及与卡或商户相关的离群金额),请使用内置转换移除这些列。选择 Add transform,然后选择 Manage Columns。选择转换类型为 Drop column。选择您要从数据集中移除的列。选择 Add 以应用转换。这些列为:CC_NUM、AMT_OUTLIER、MERCHANT、MERCHANT_AMT_OUTLIER。
D. 质量分析和模型导出
数据准备完成后,您将运行质量分析报告以获取数据洞察。该洞察报告可识别常见数据问题,如目标泄漏或类别不平衡,帮助用户在工作流早期解决这些问题。
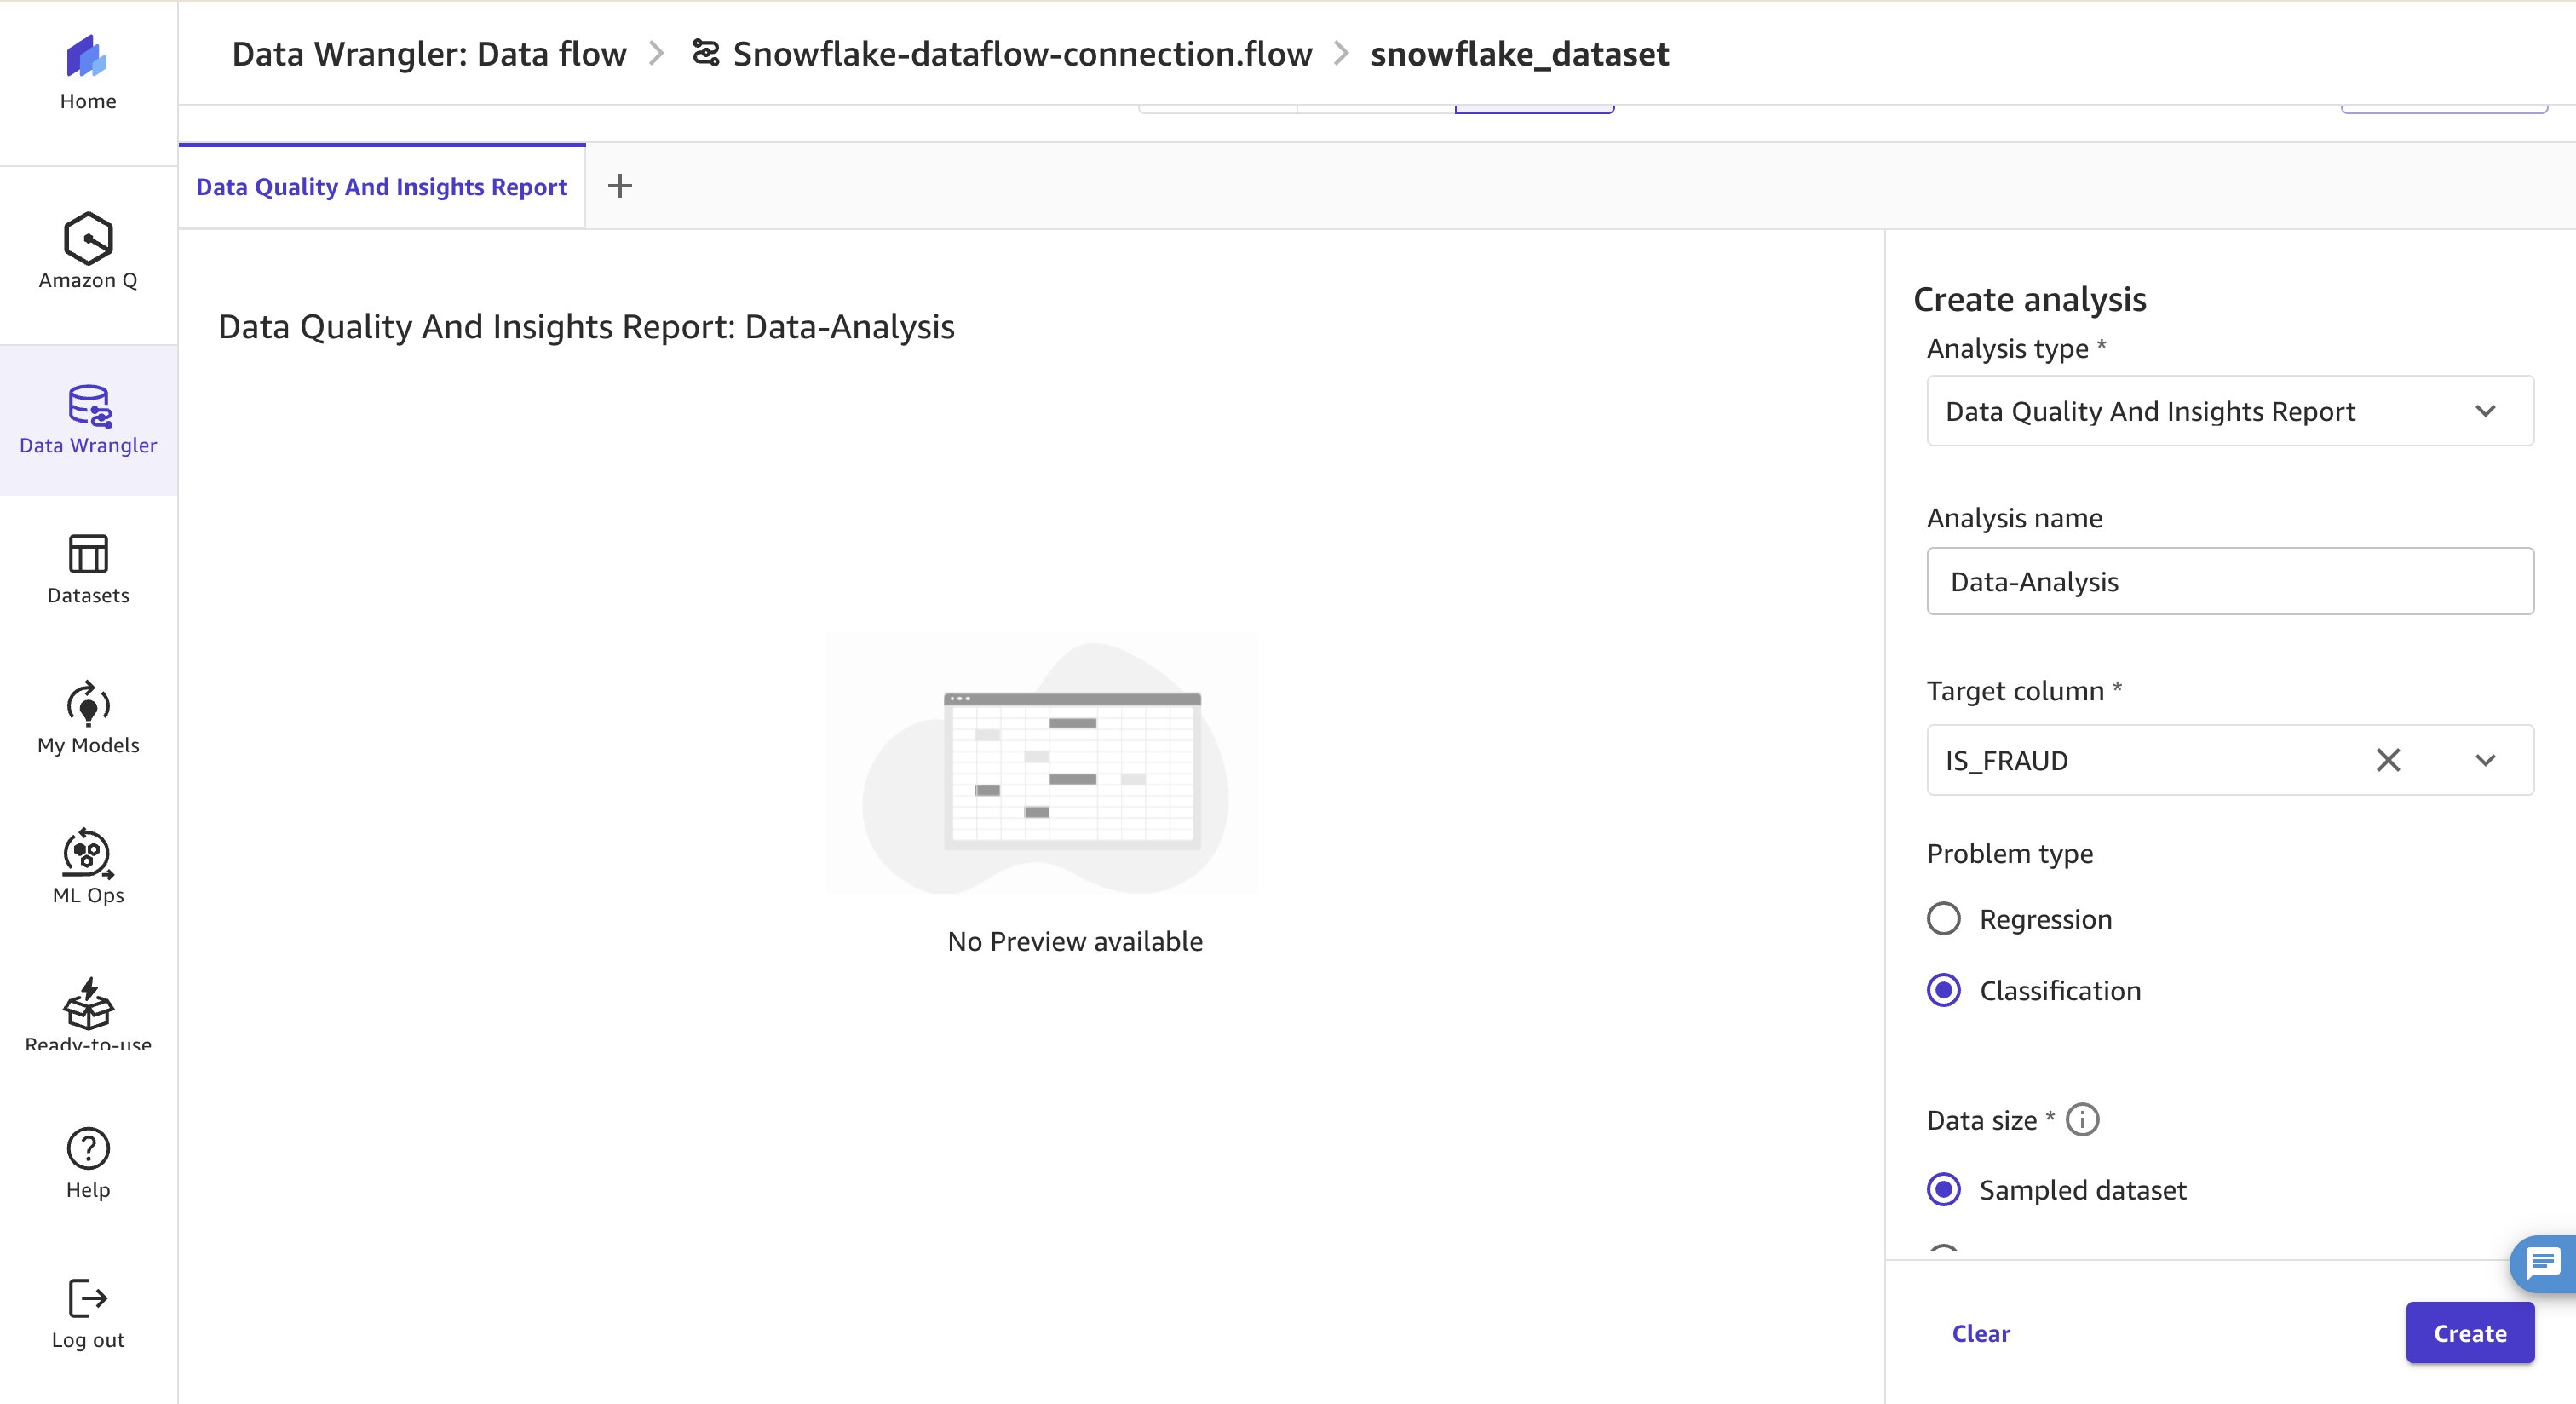
- 要启动分析,请选择 Analyses 选项卡。在右侧面板中,从 Analysis type 列表中选择 Data Quality and Insights Report。
- 选择 IS_FRAUD 作为目标列。这告诉 Canvas 您想要预测哪个变量。然后在 Problem type 下选择 Classification 选项。Data size 应保持为 Sampled Dataset。最后,选择 Create 启动分析。
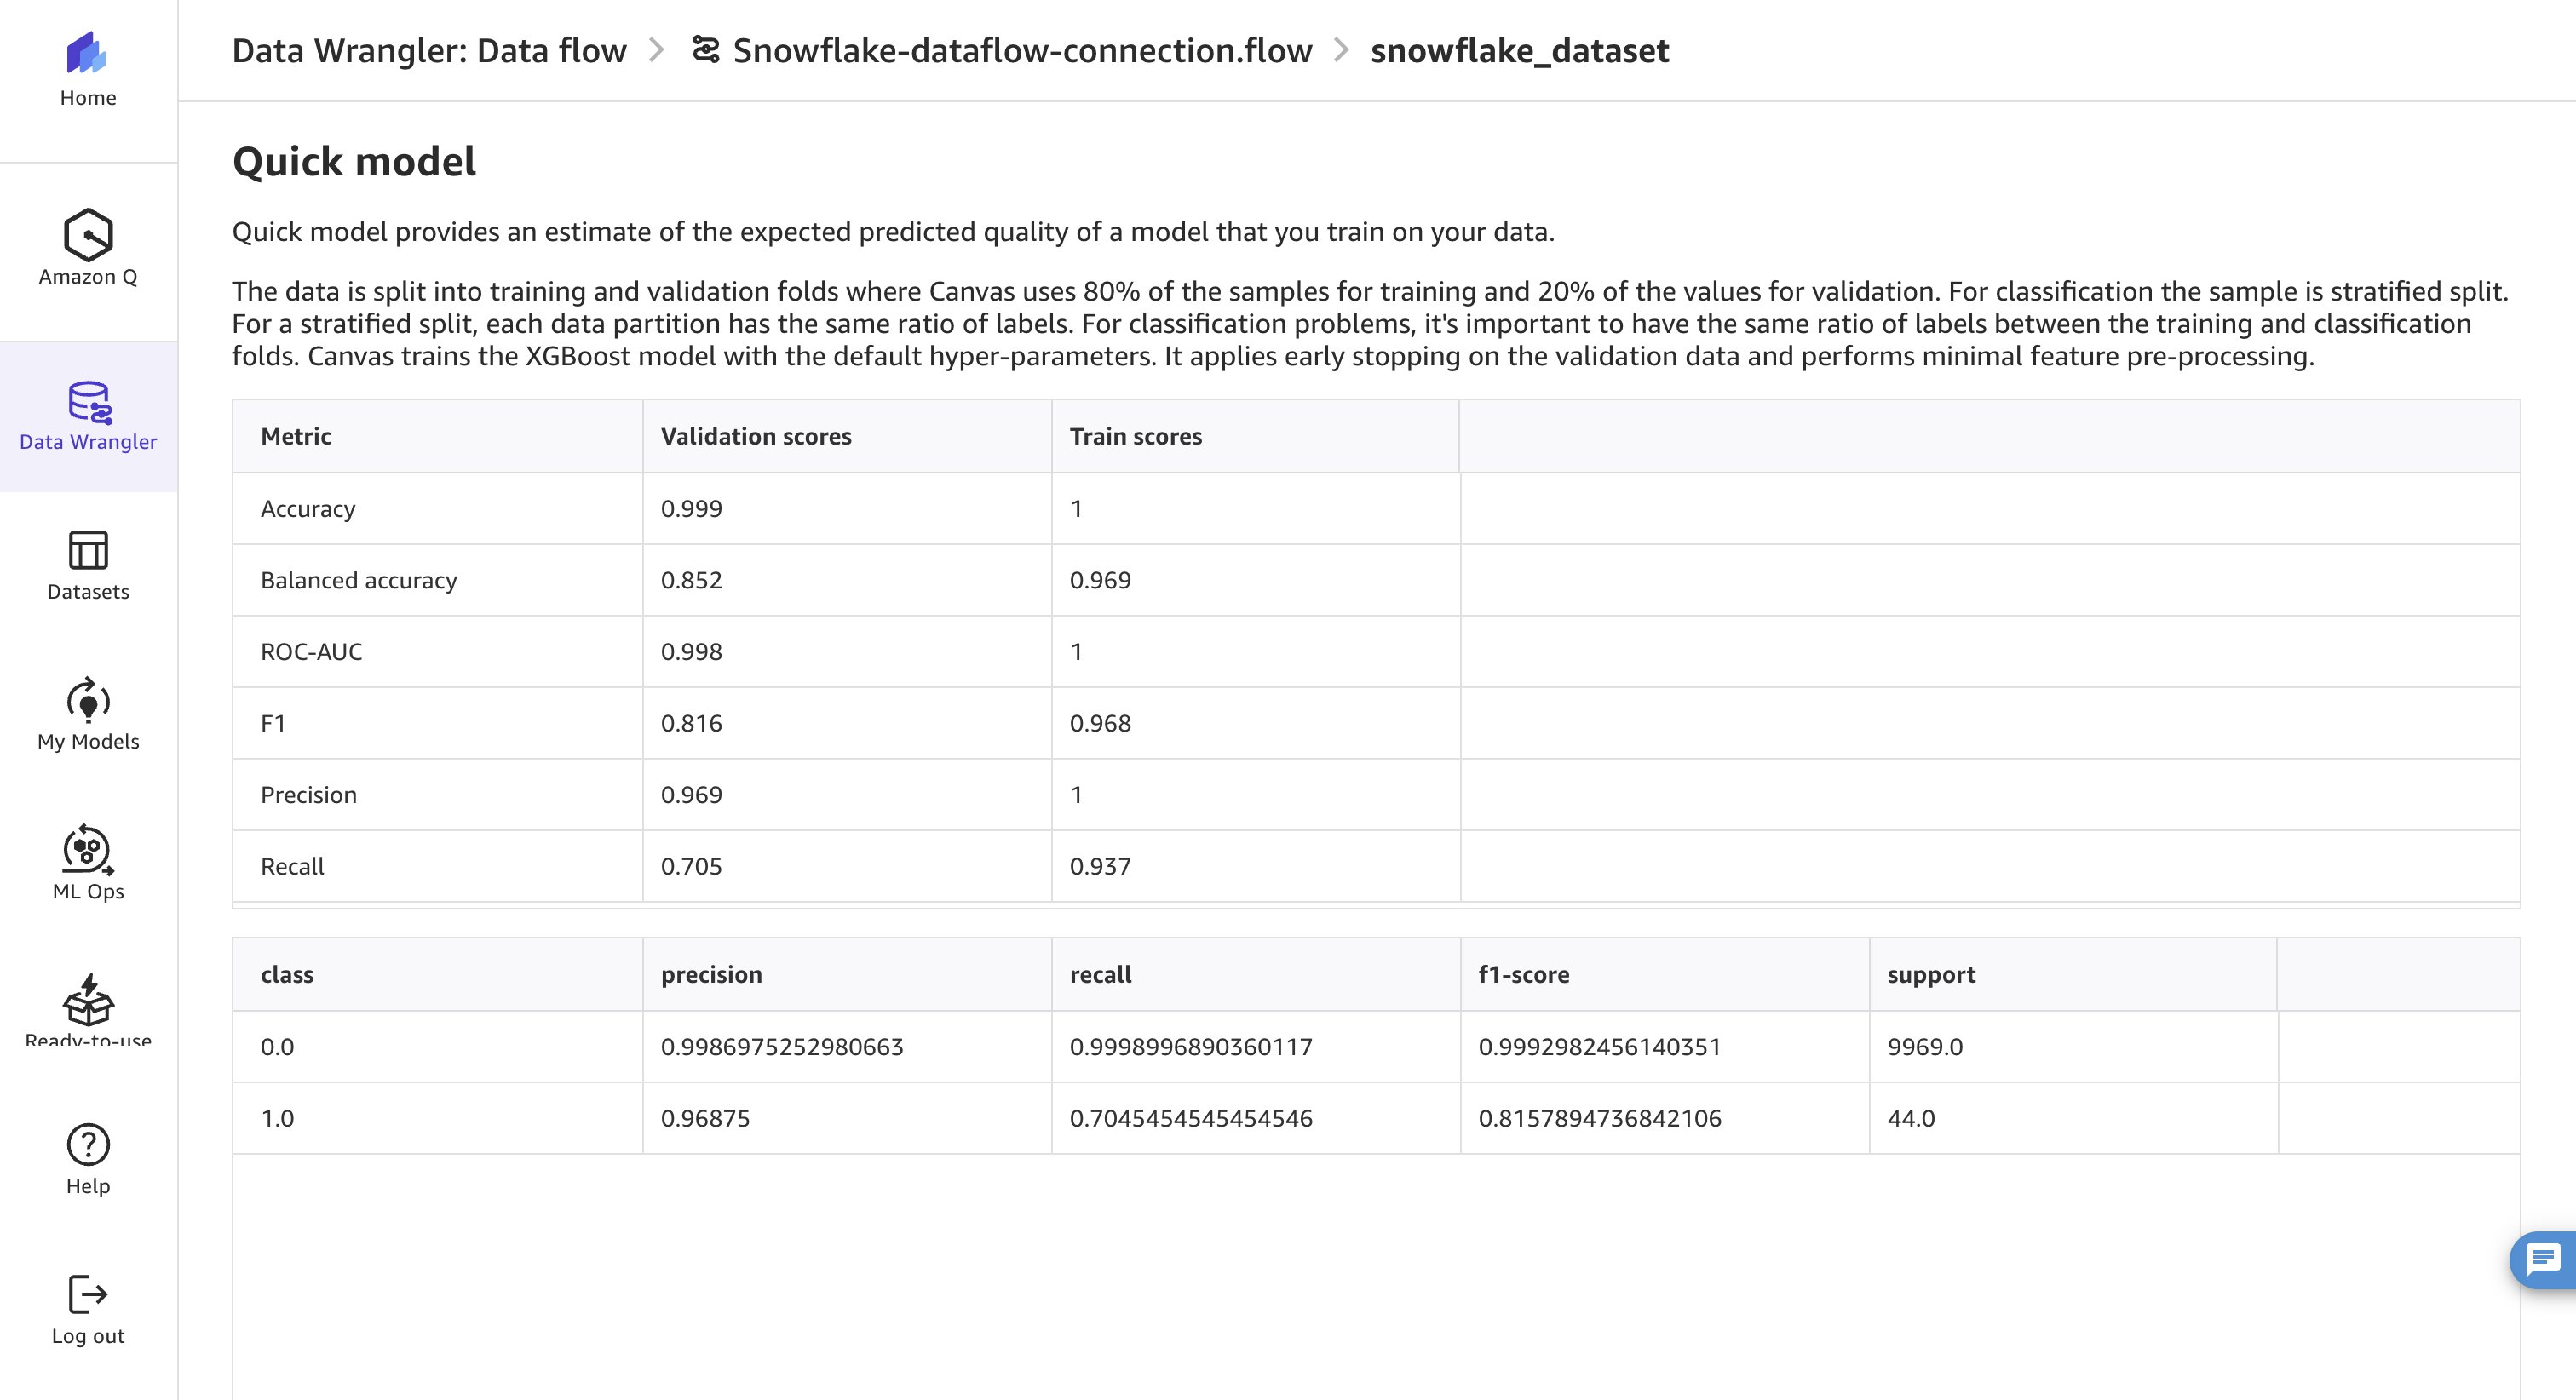
- 几分钟内,将生成一份详细的分析报告,其中包括数据快速摘要、特征摘要、重复行、异常样本等内容。在 Quick model 部分,查看训练和验证数据集中的准确率指标。混淆矩阵紧随准确率统计之后。其理念是在任何数据工程之后使用此报告,以观察其对模型质量的影响。
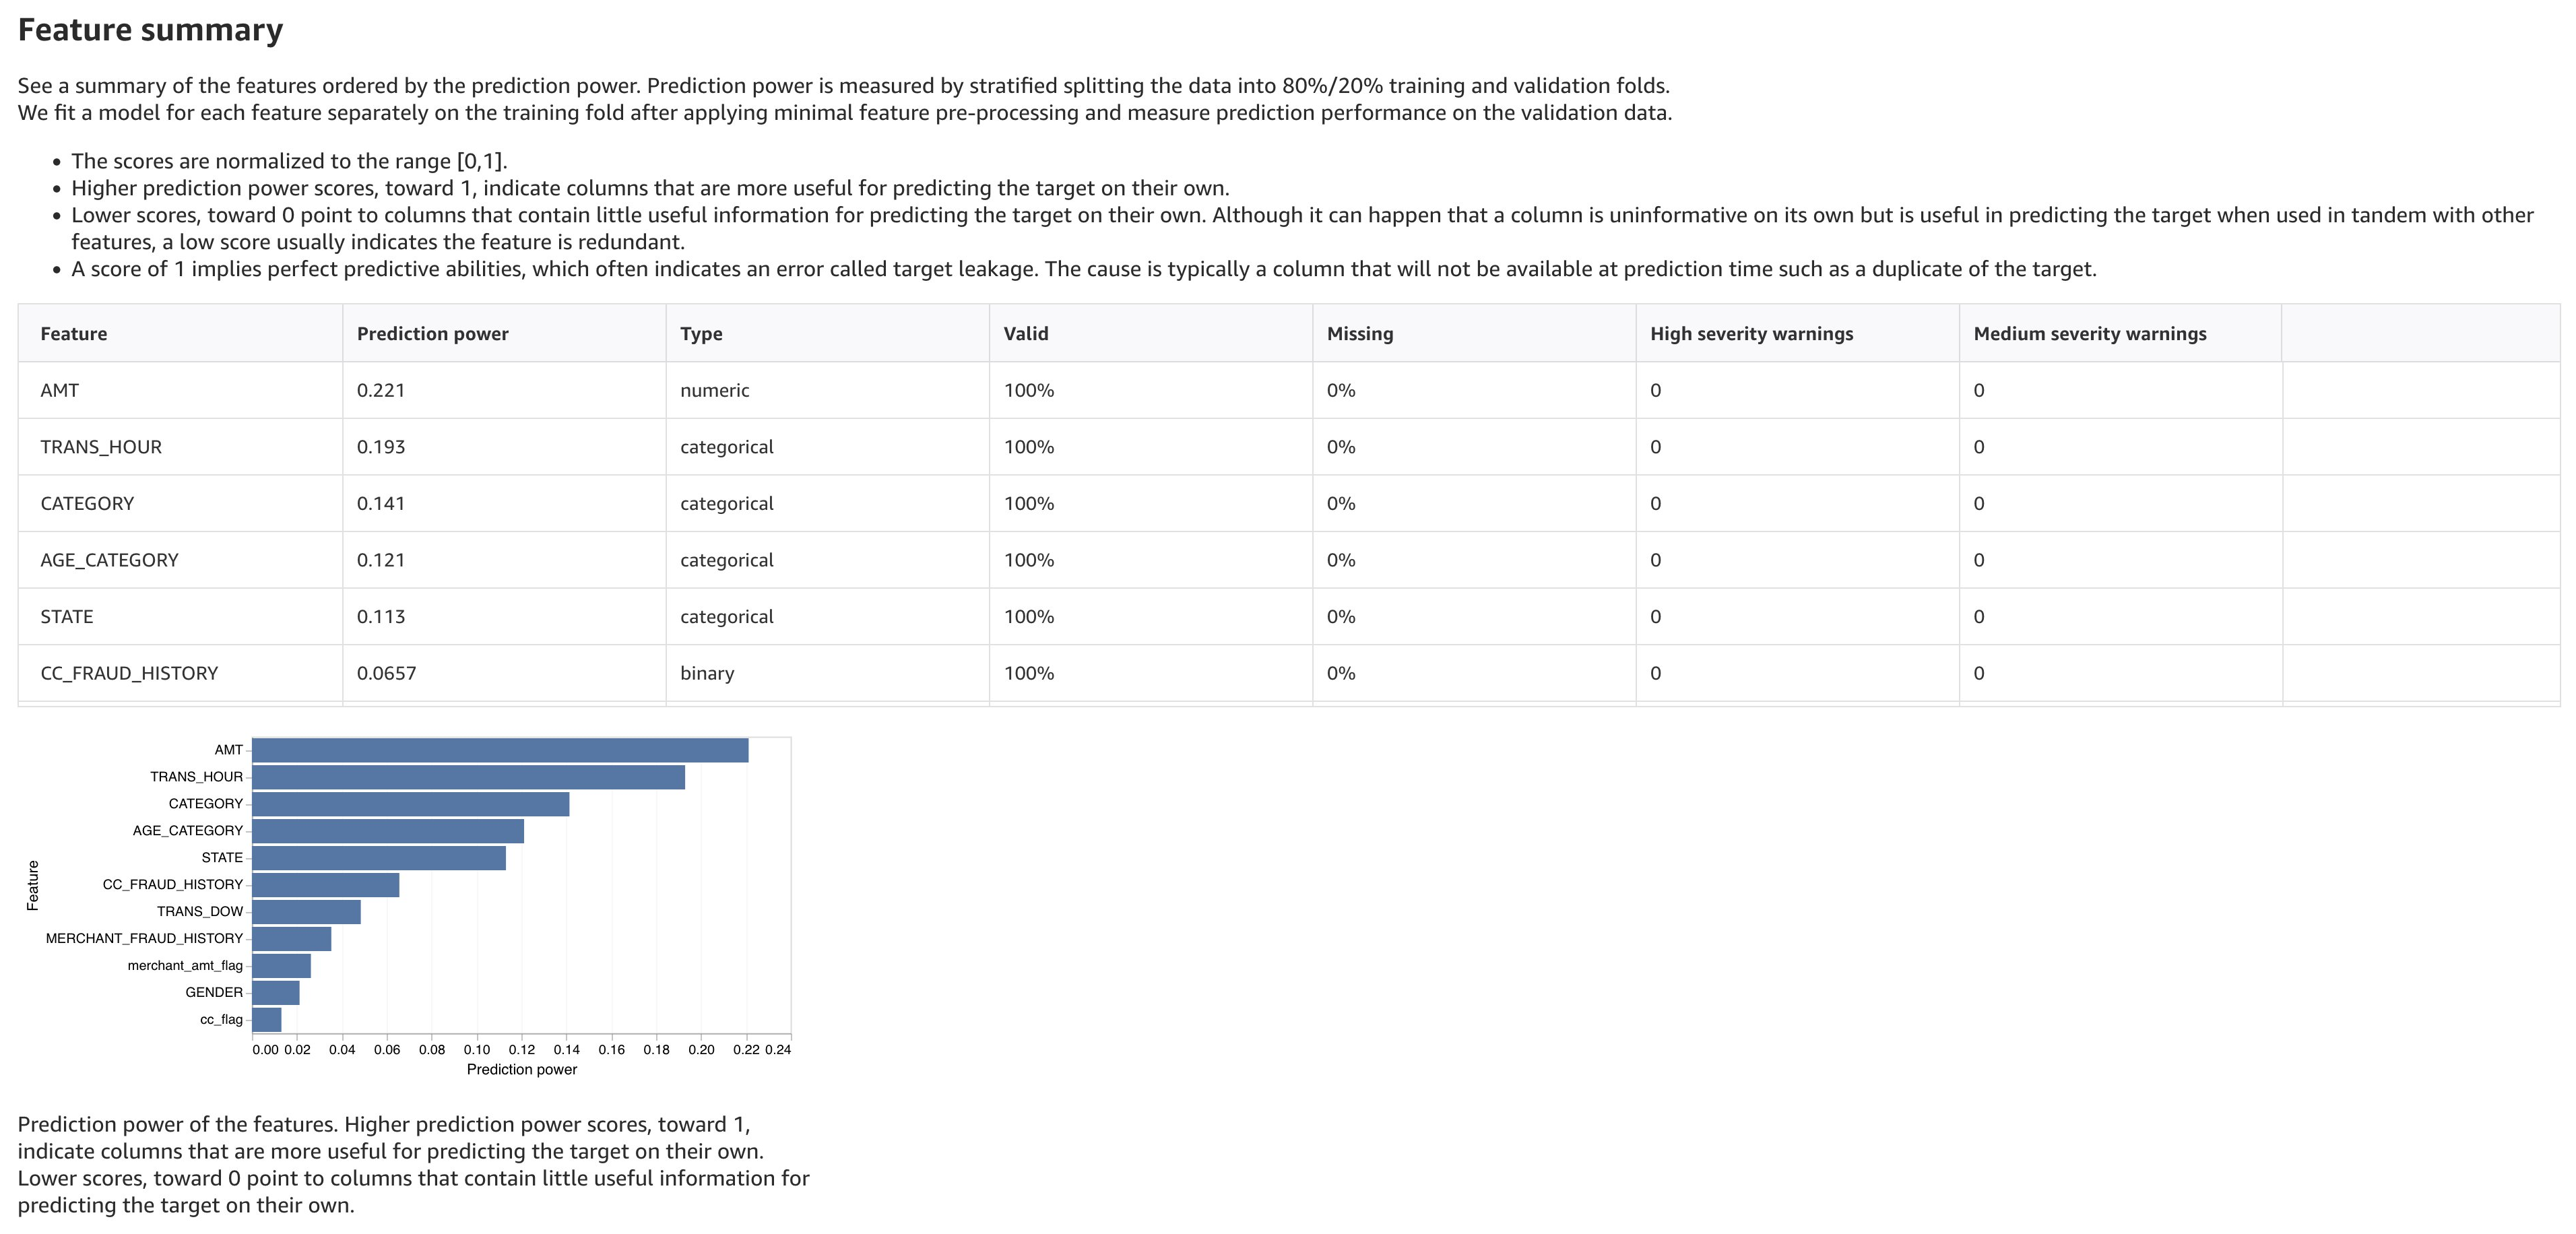
- Feature summary 部分显示特征重要性。在实践中,如果某些特征的预测能力较低,您可以选择删除这些特征。
导出到模型构建
现在,您已经合并了两个数据源,设计了新特征,移除了不必要的特征,并通过运行分析预览了模型的潜在准确率。数据准备完成后,是时候构建您的预测模型了。
- 首先,返回 Data flow 选项卡,选择最终转换旁边的加号(+),然后选择 Create model。
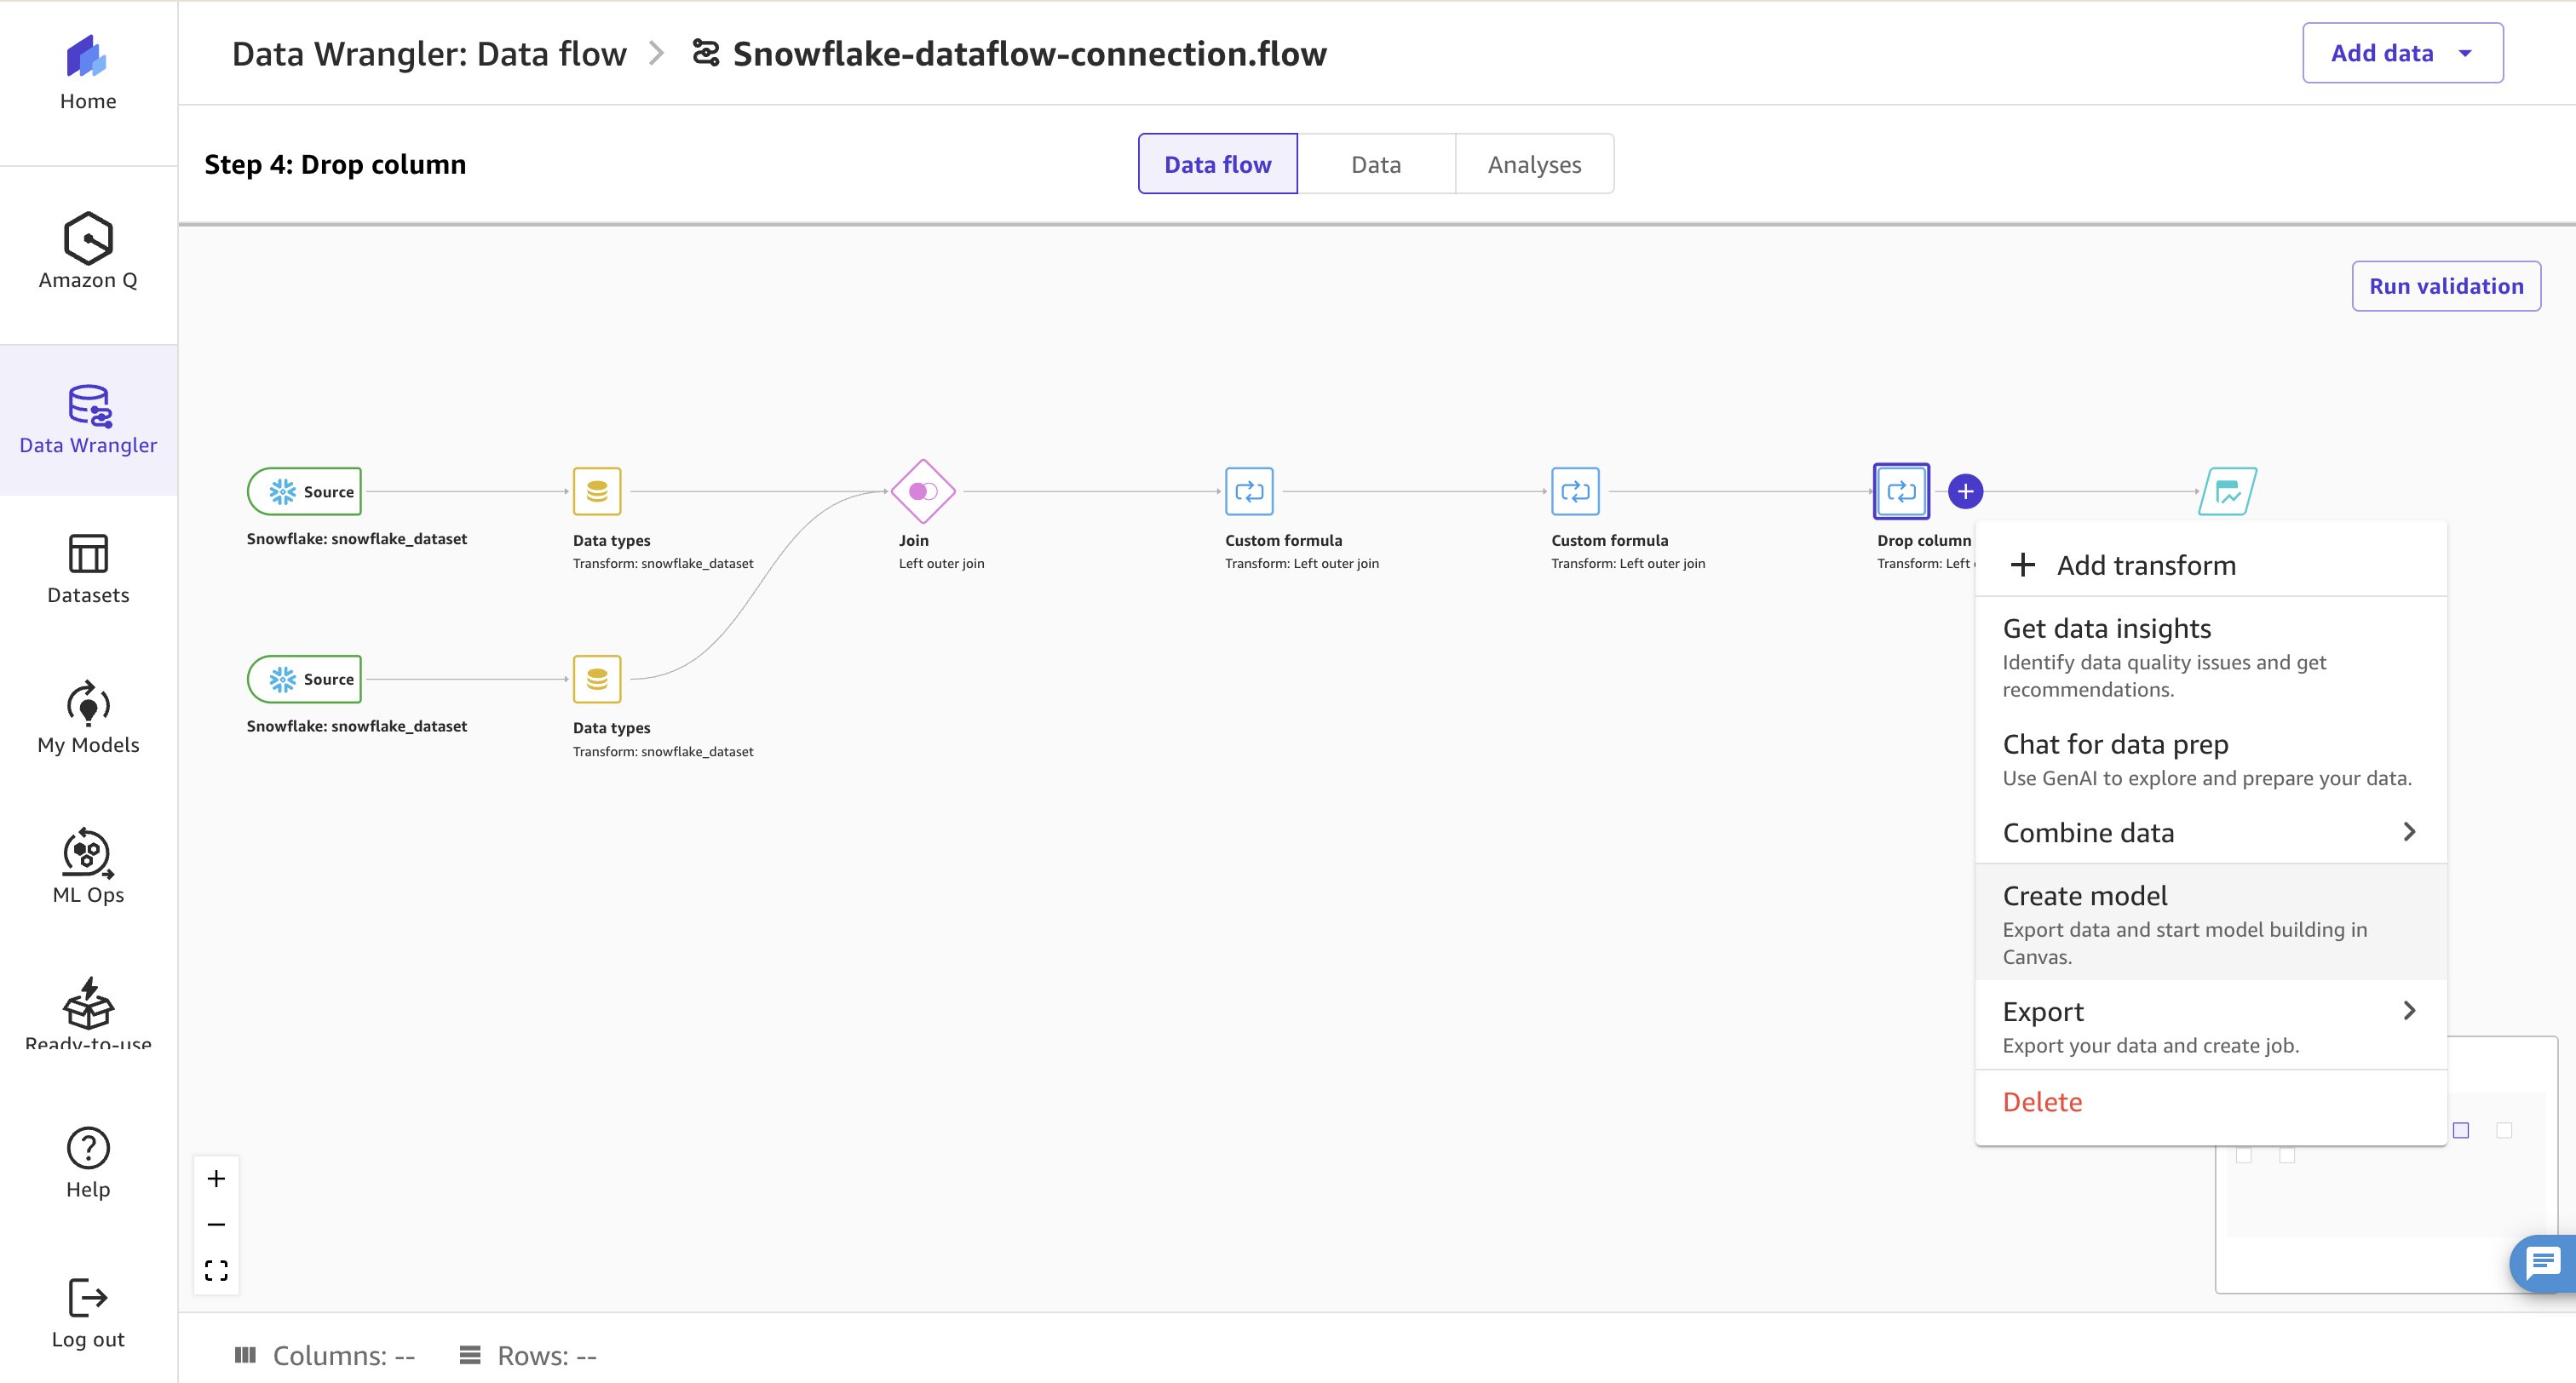
- 在 Model name 下输入描述性名称,然后选择 Export and create model。导出过程可能需要几分钟,因为 Canvas 会实时处理您的整个数据集。
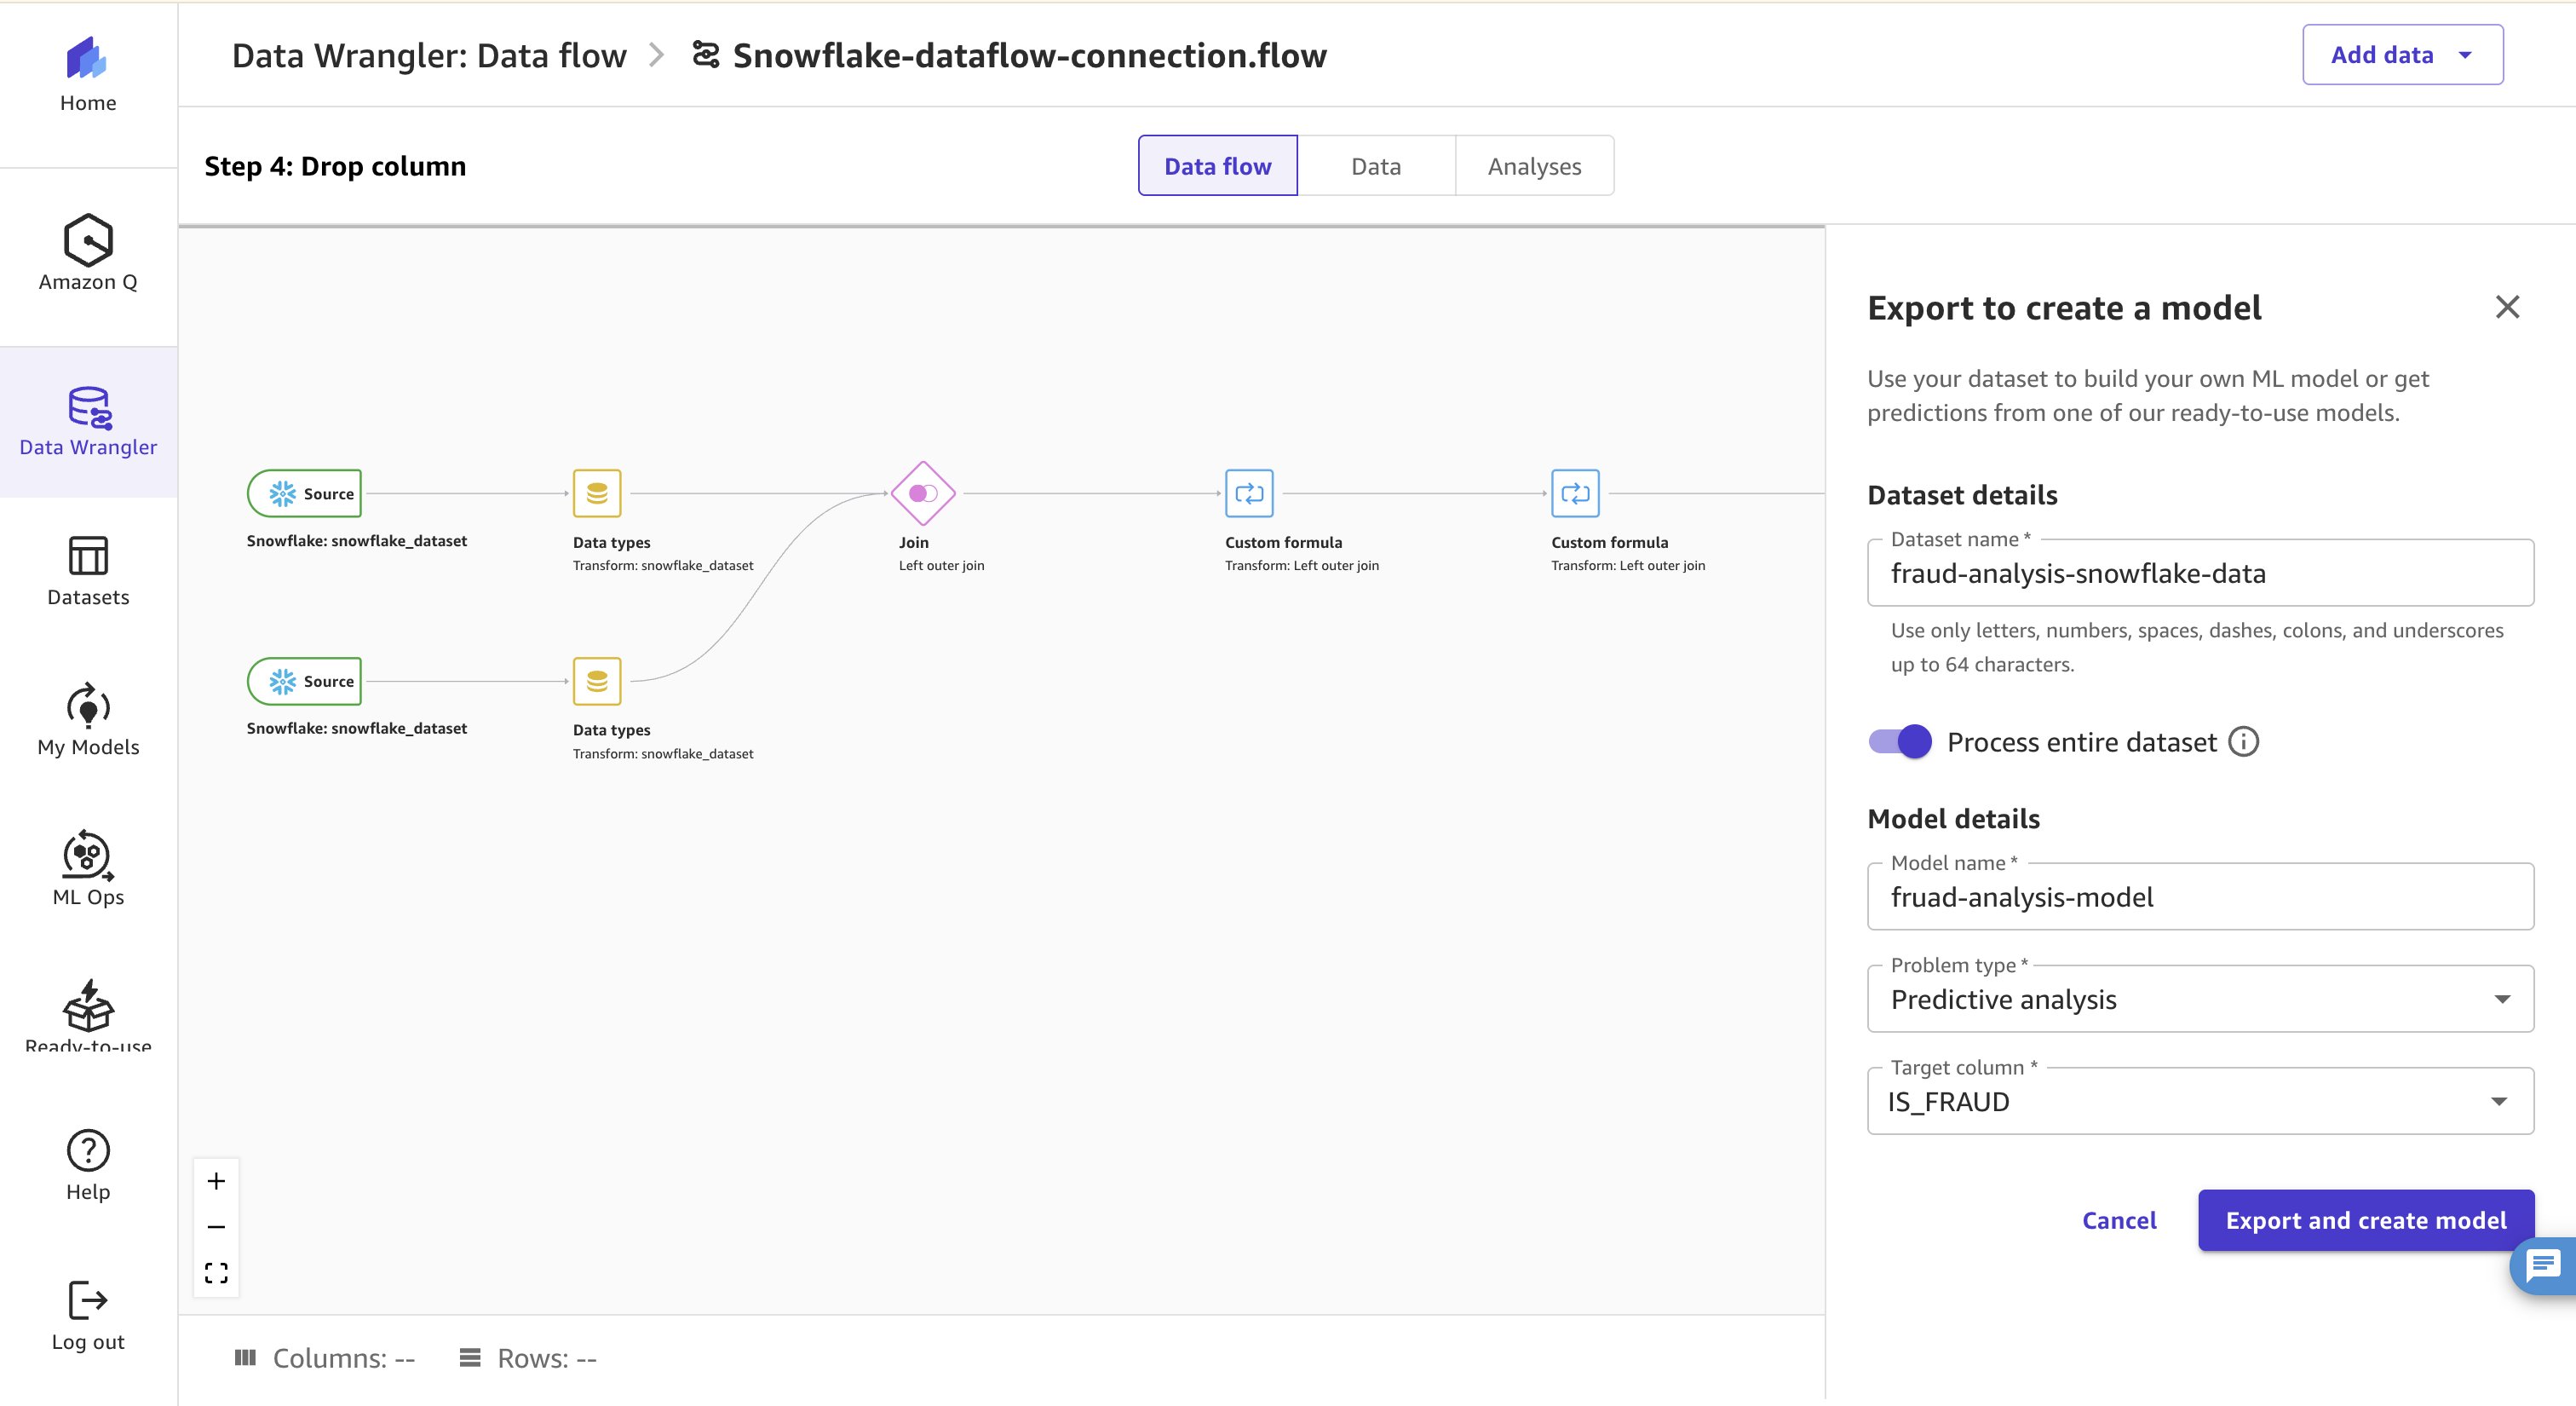
几分钟后,Build 屏幕将打开。
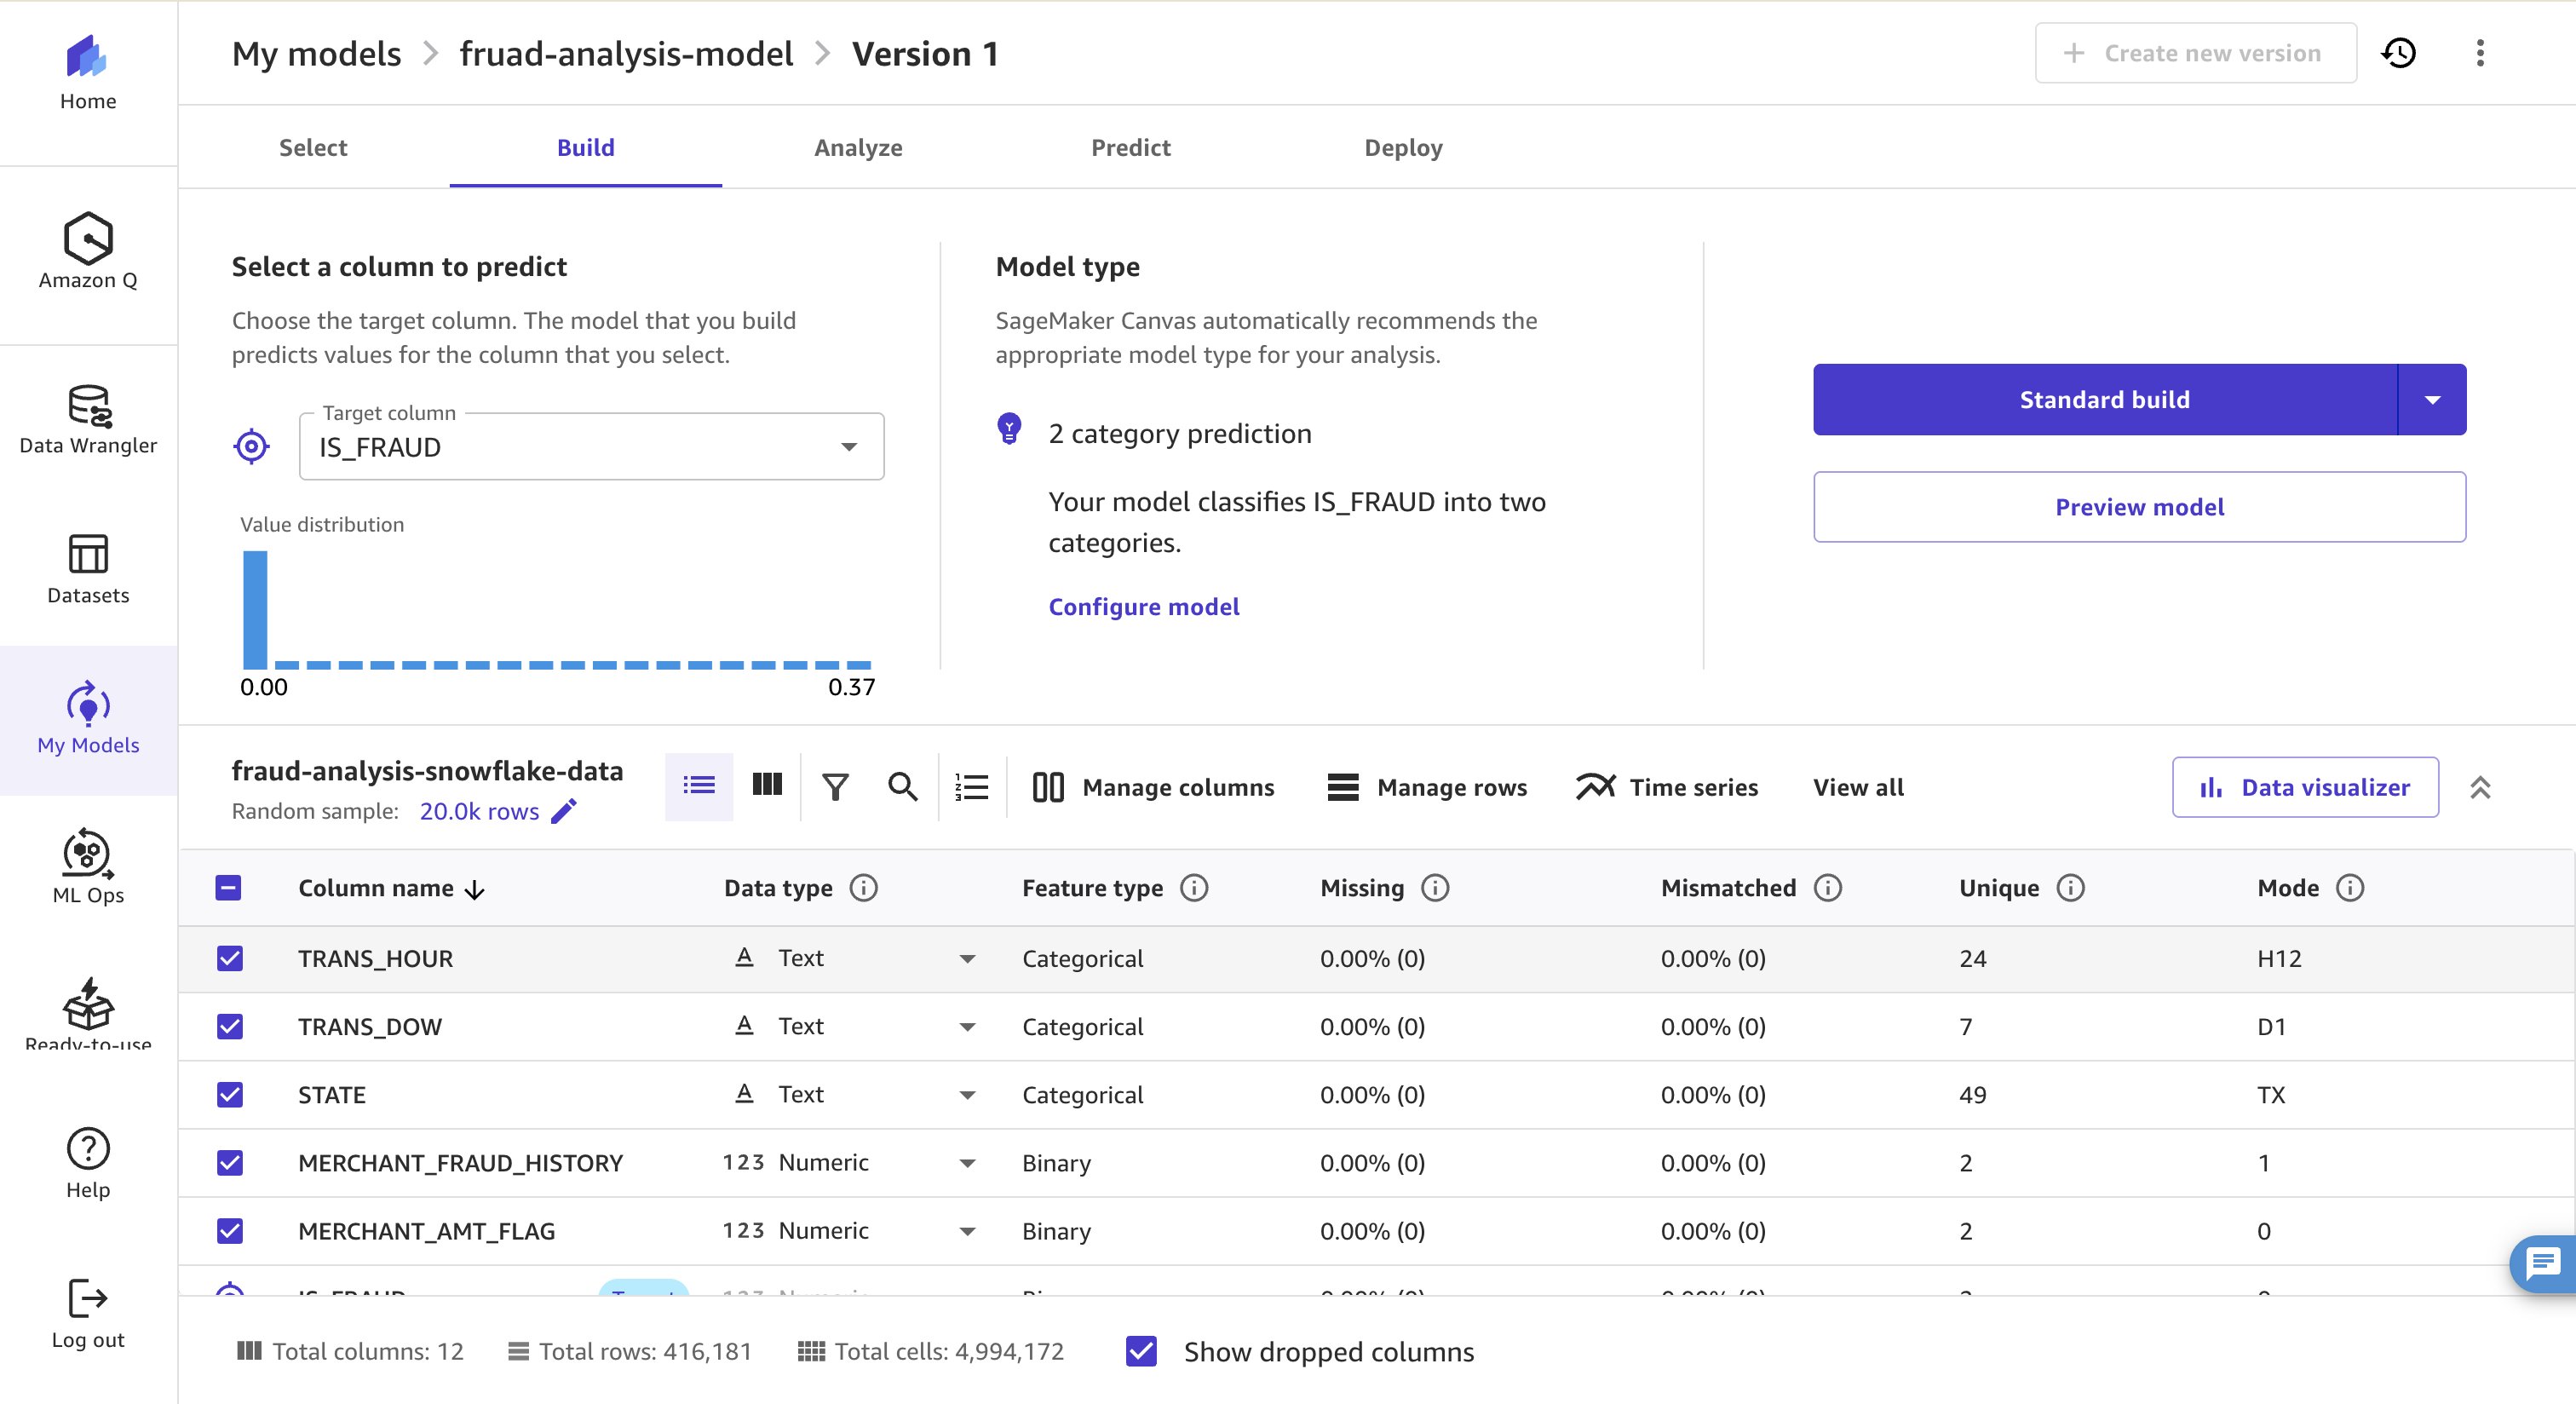
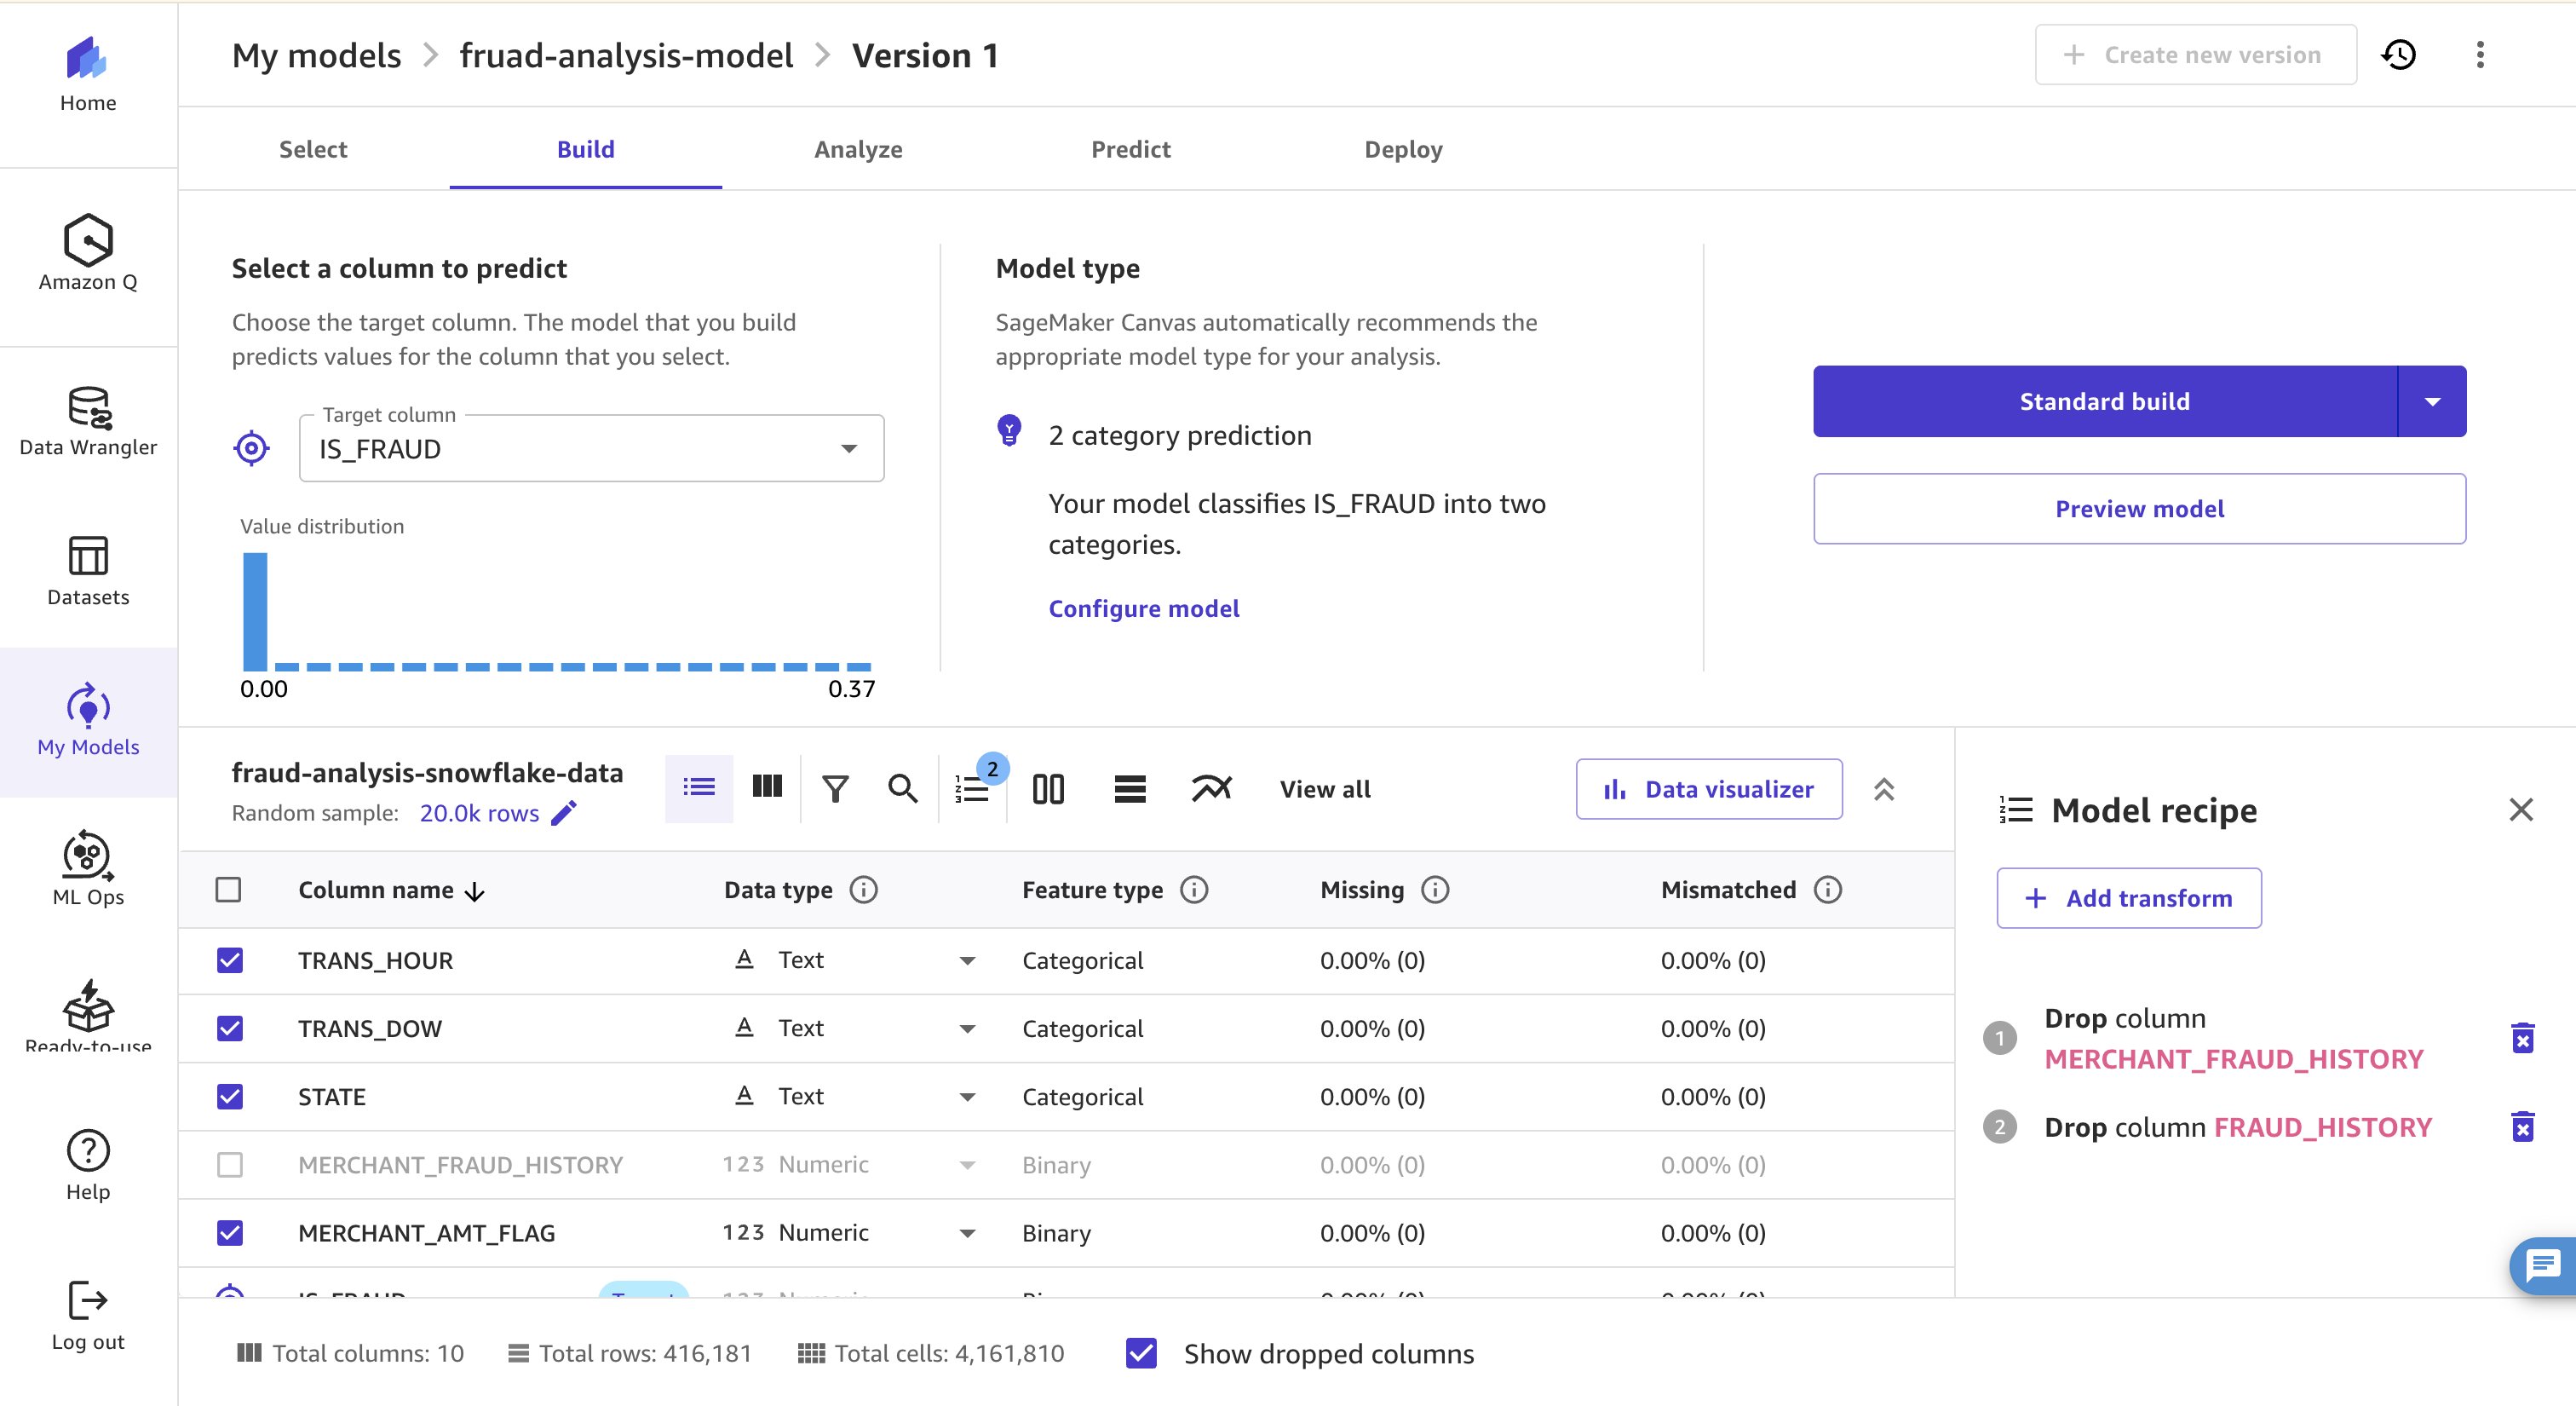
- 选择 IS_FRAUD 作为 Target Column(目标列)。
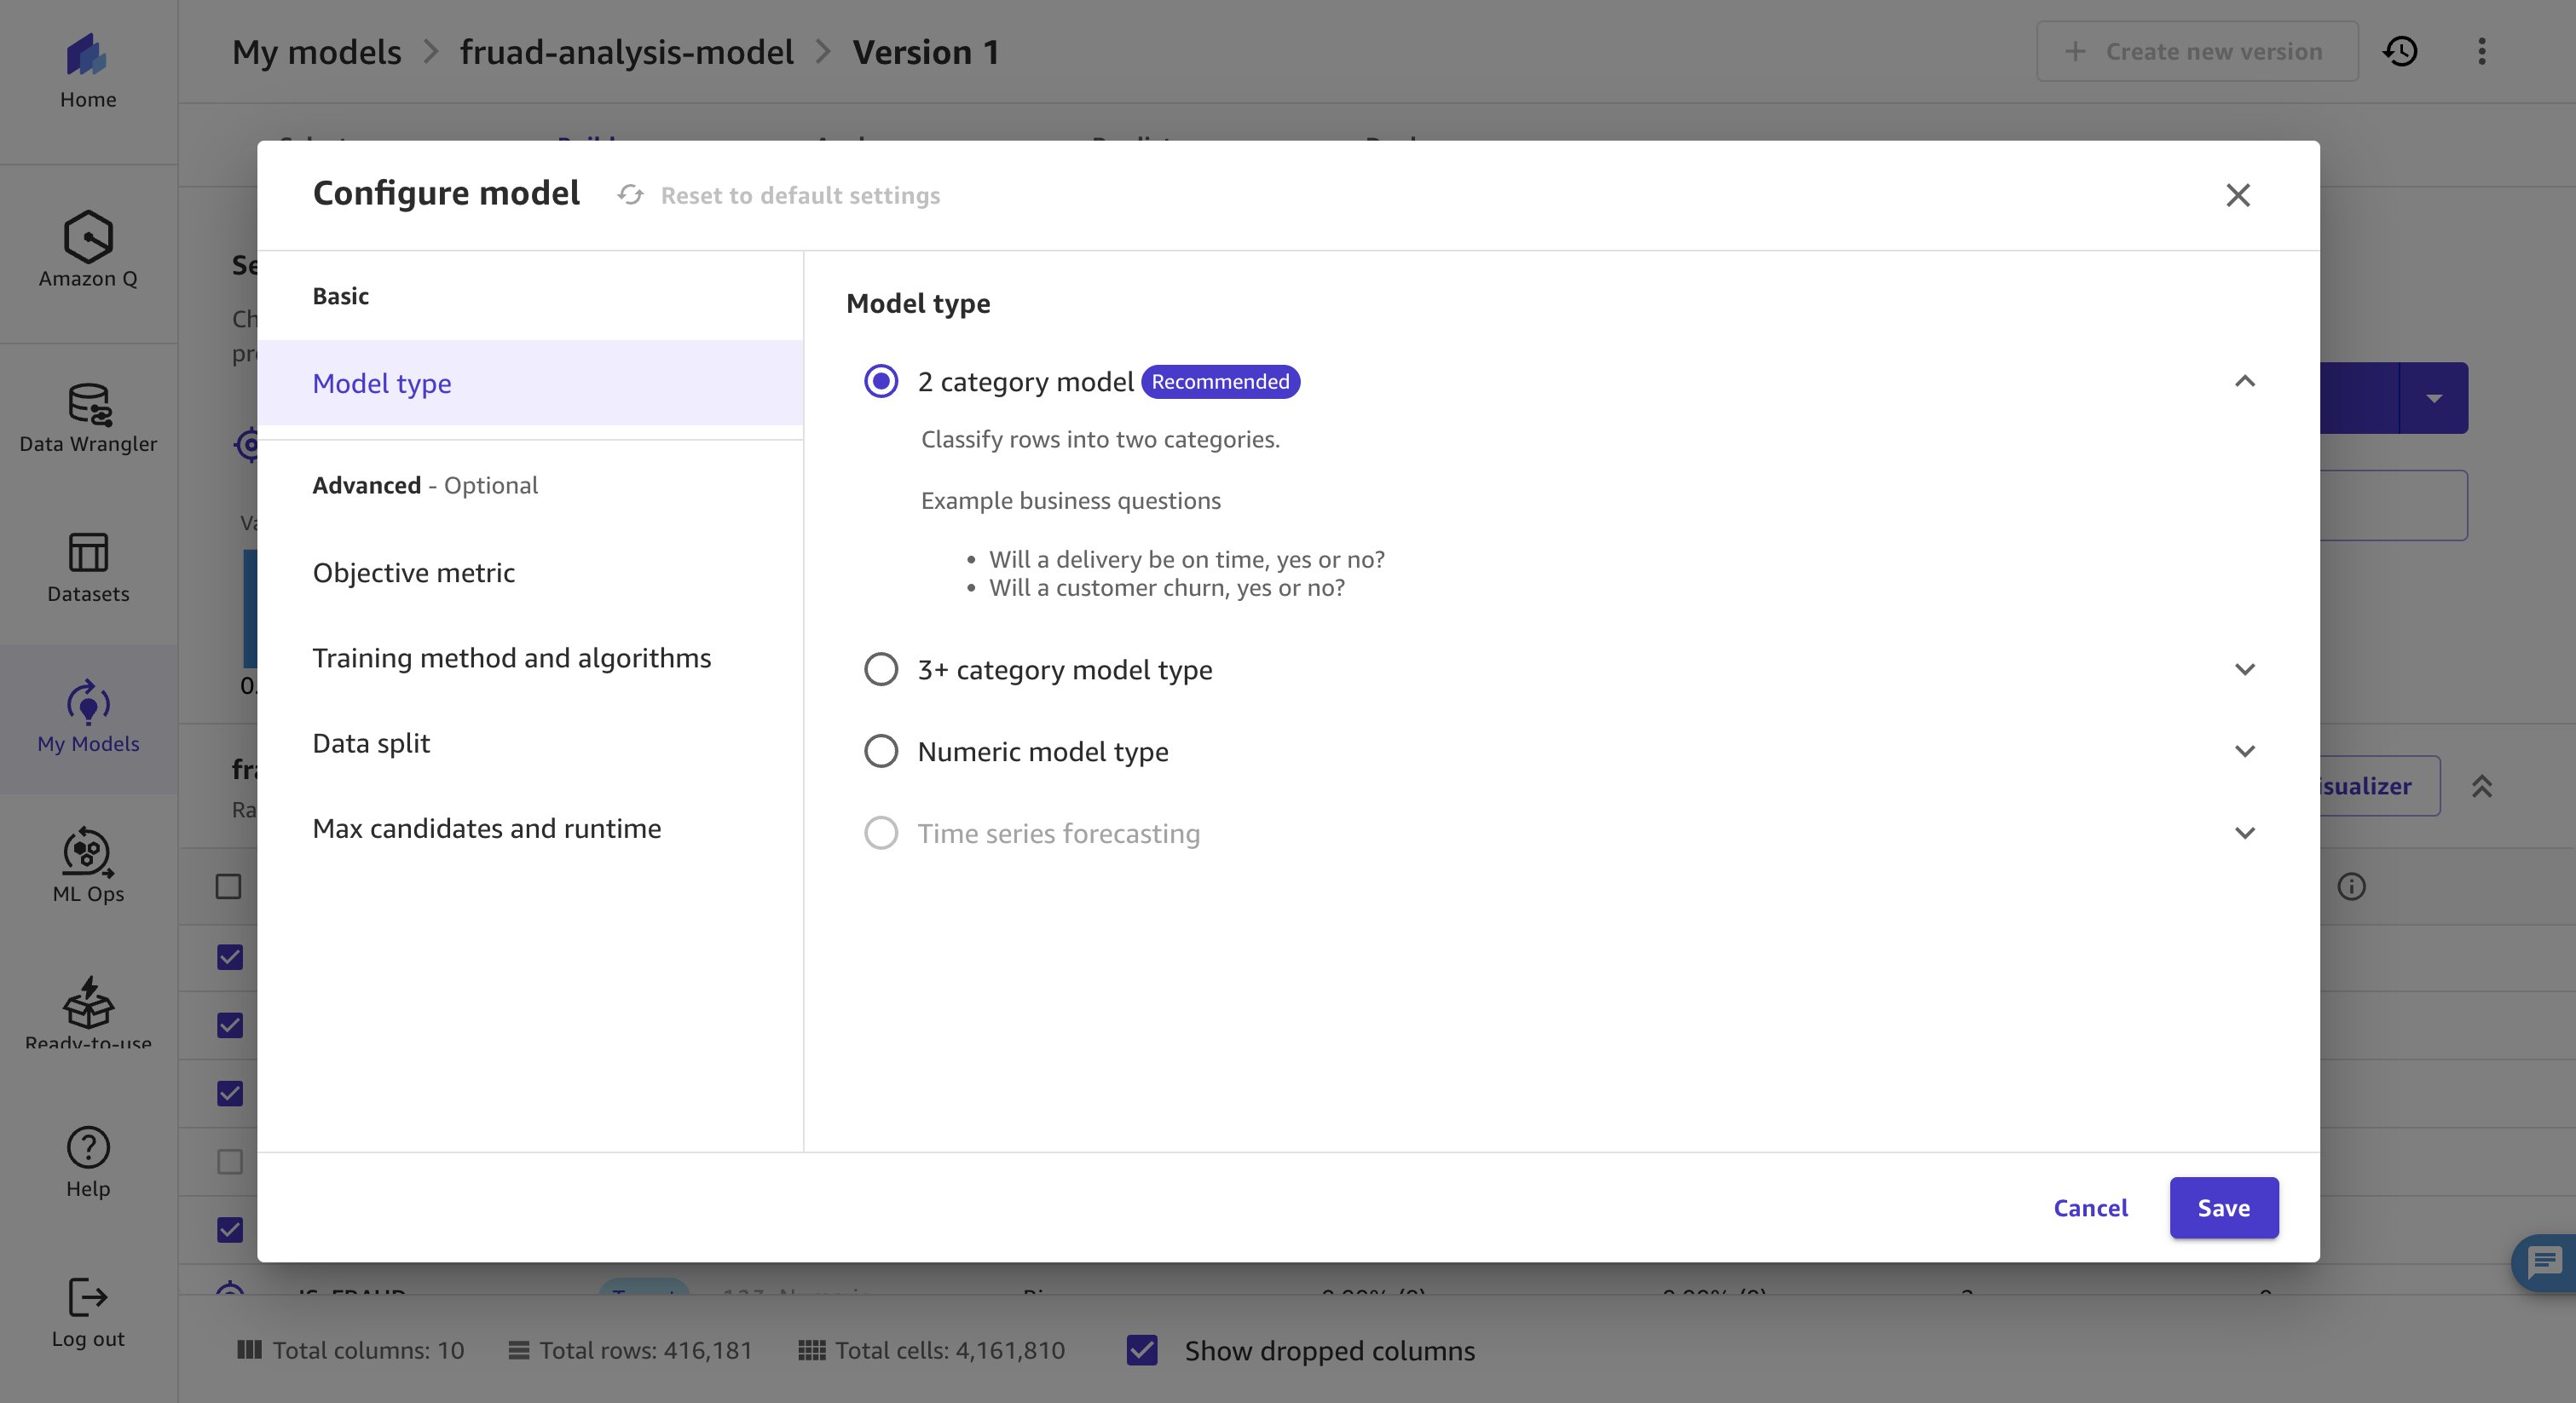
- 在 Model type 下选择 Configure model。选择 2-category model 作为模型类型。
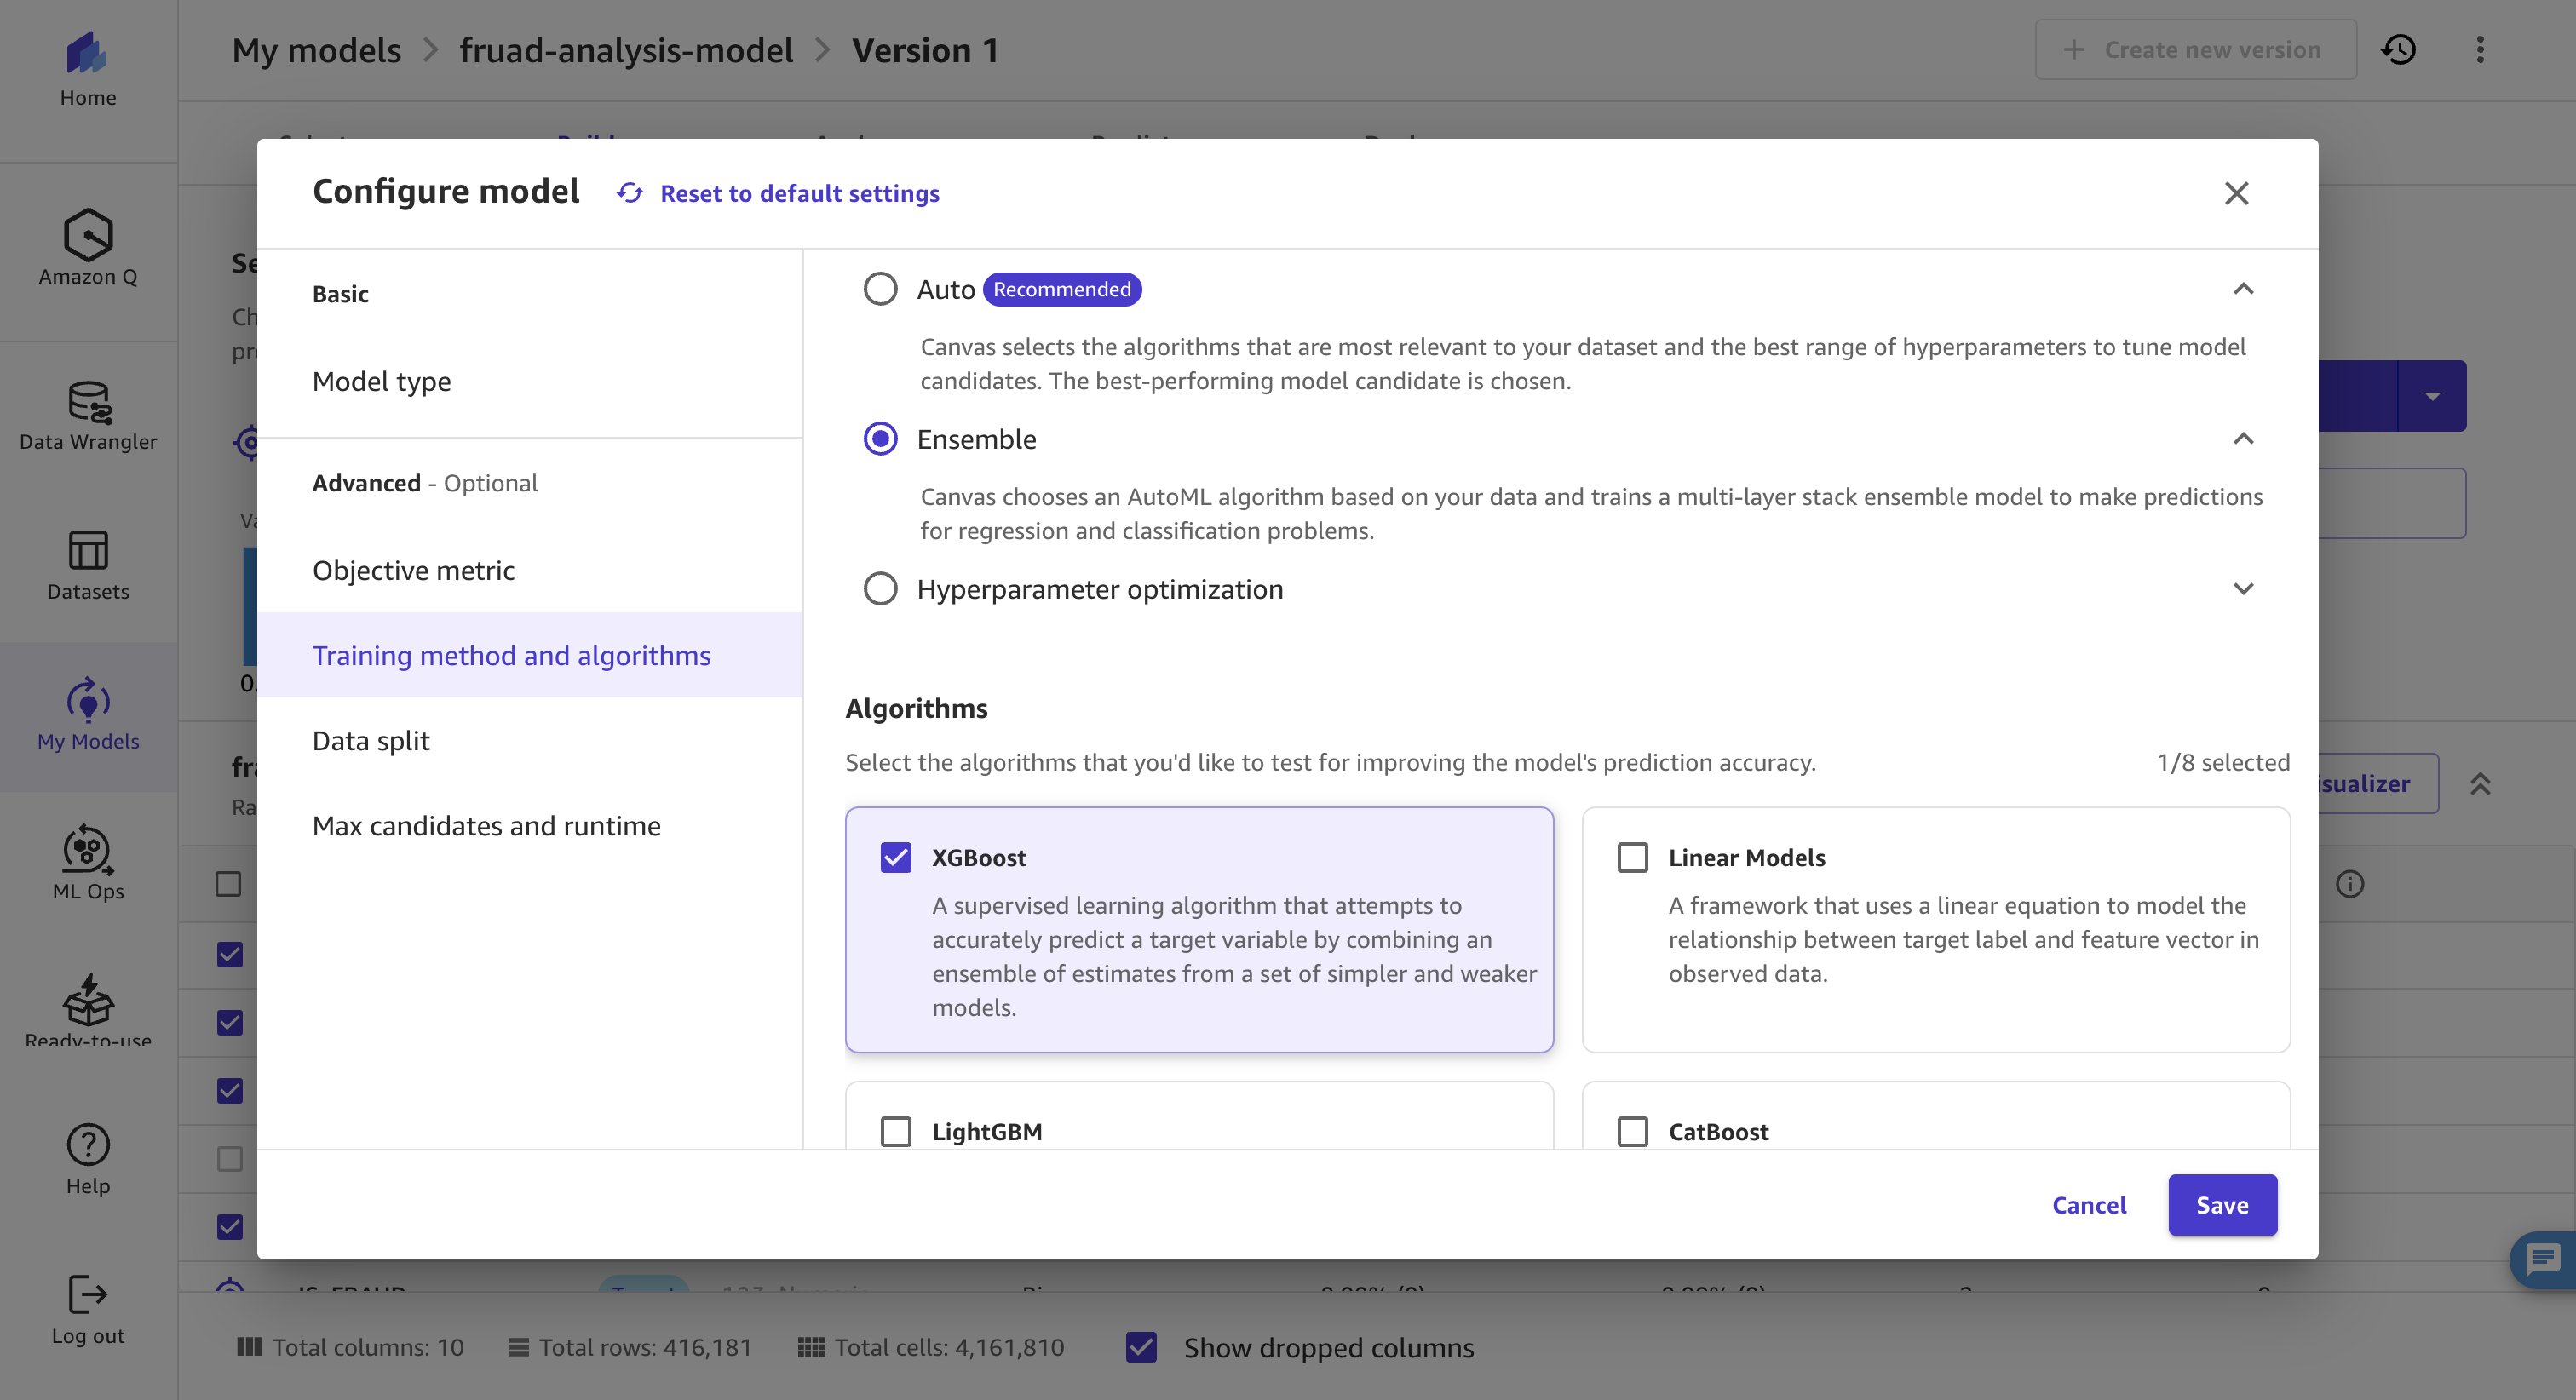
- 接下来,选择 Ensemble 作为训练方法,并使用 XGBoost 作为算法,这是一个在准确性和效率之间取得平衡的战略性选择。
- 取消选择 FRAUD_HISTORY 和 MERCHANT_FRAUD_HISTORY 列,然后选择 Standard build 开始训练。模型大约需要 15–30 分钟完成训练。
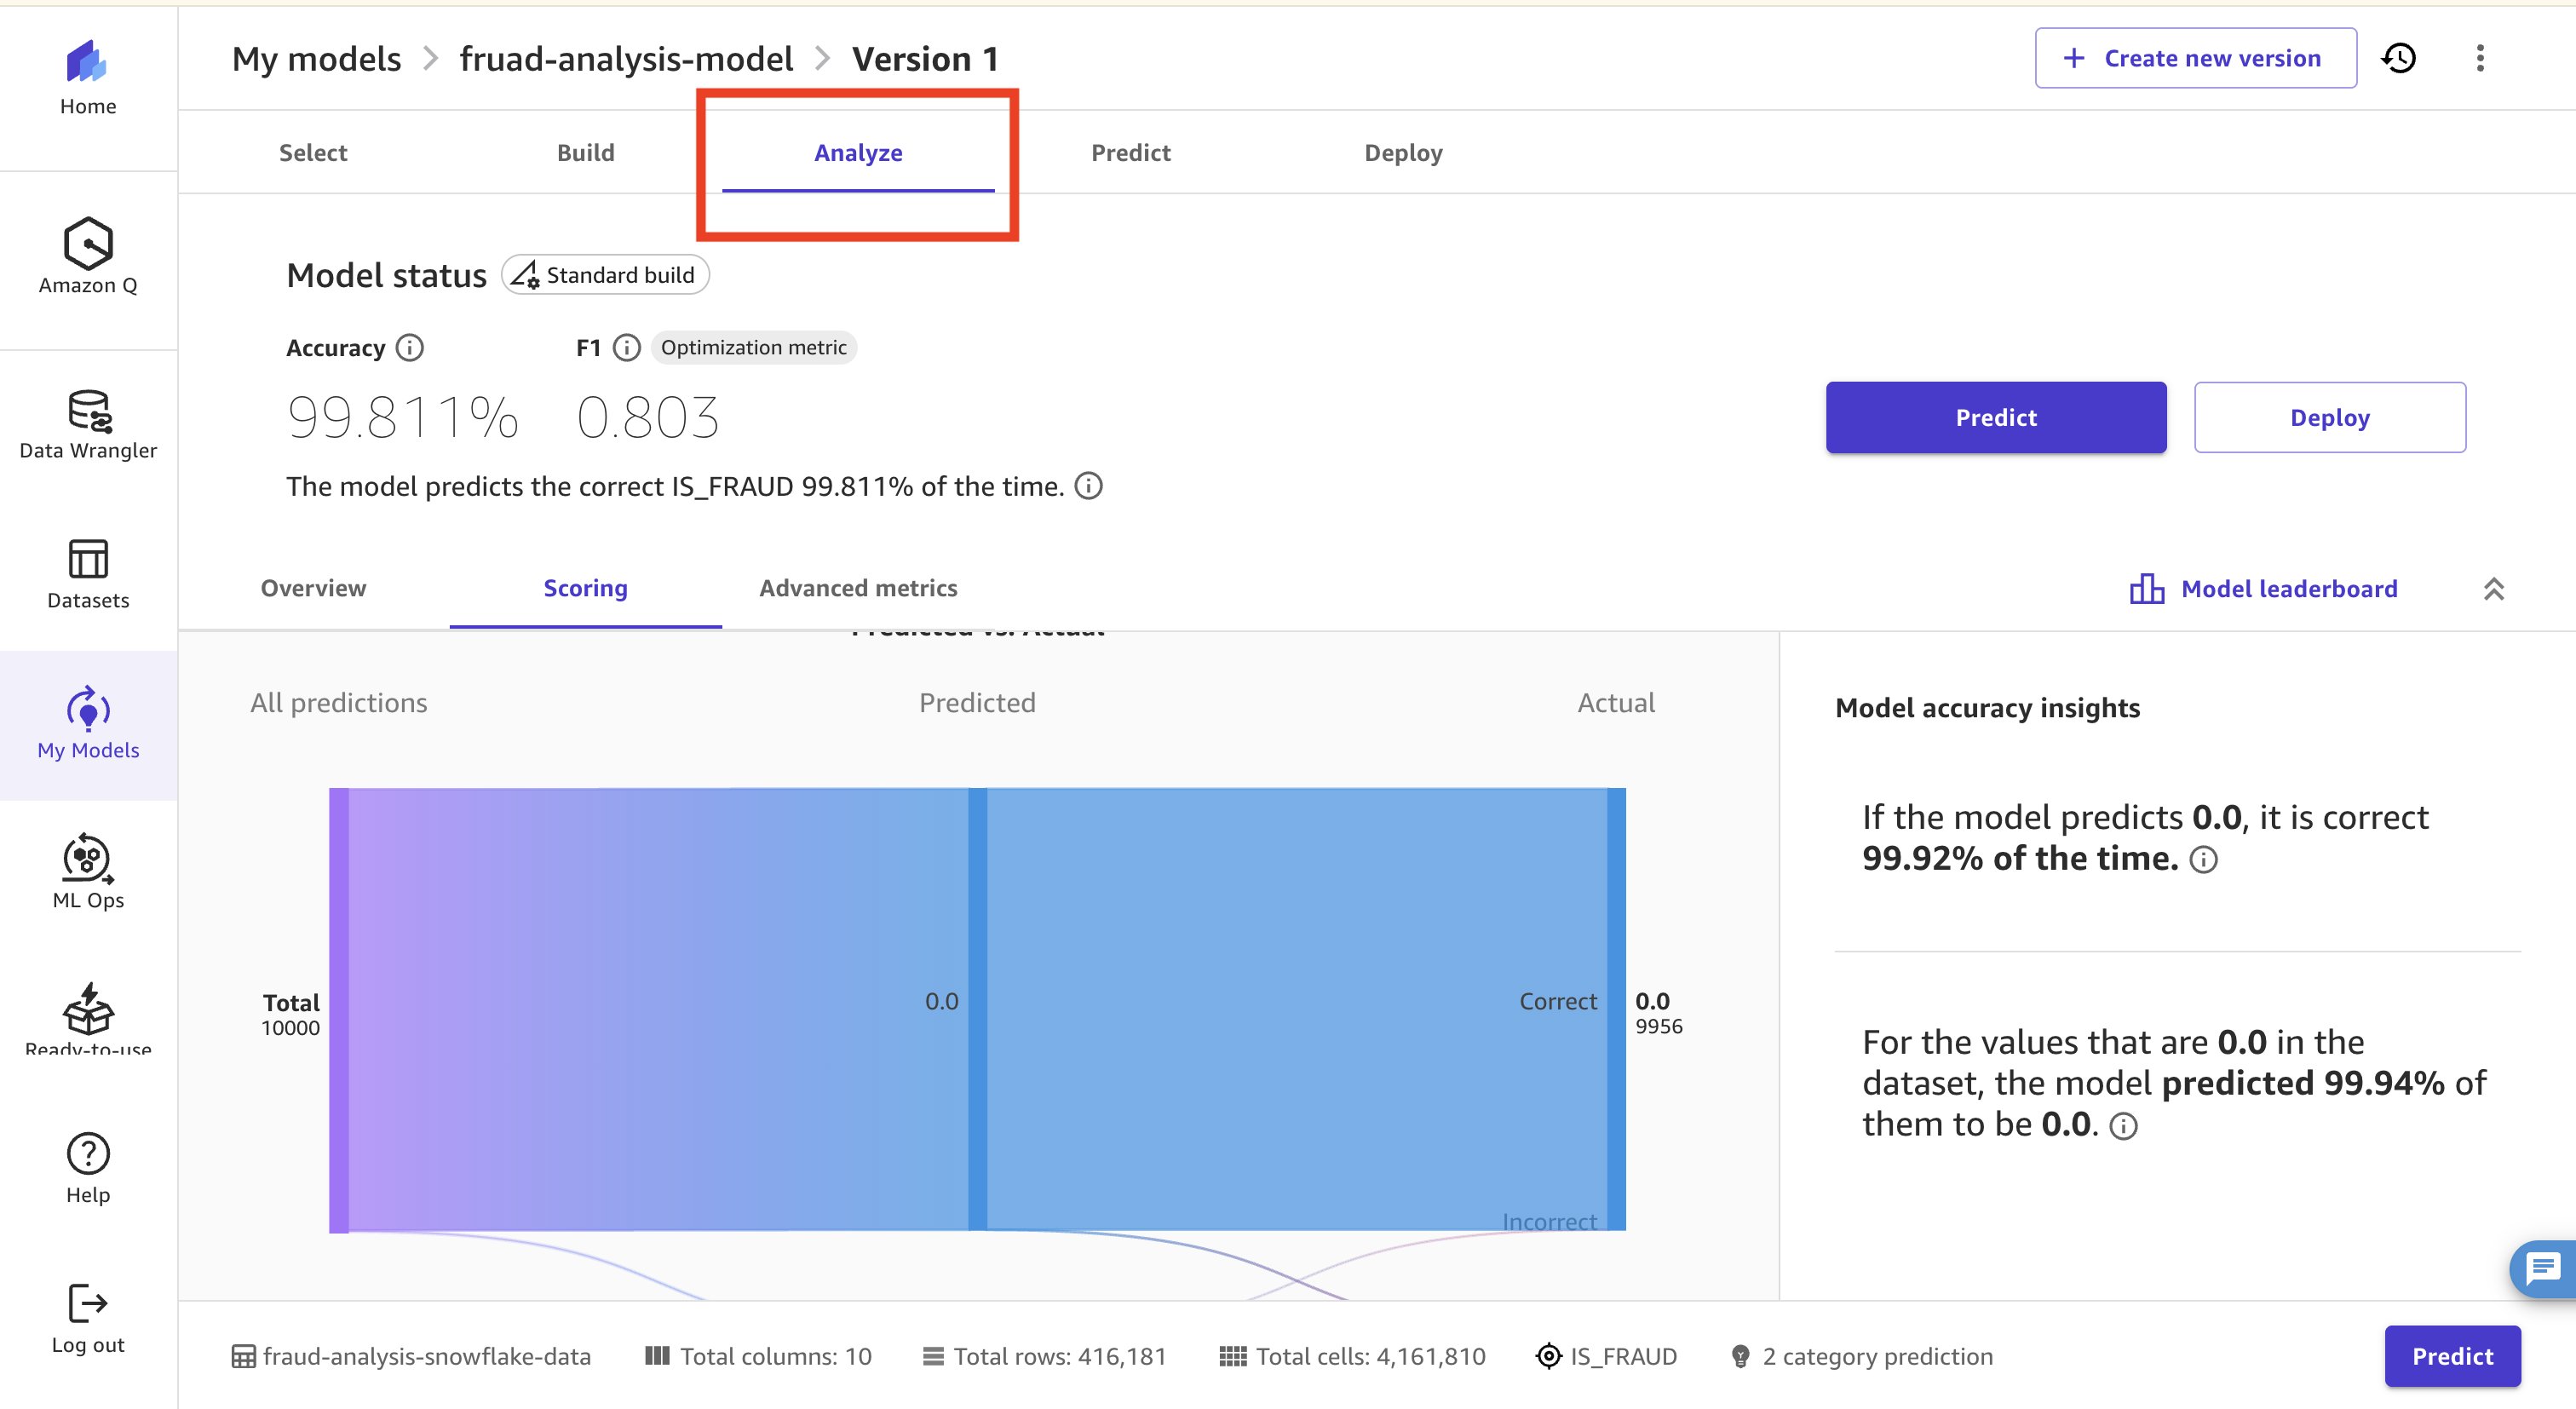
- 模型训练完成后,导航到 Analyze 选项卡查看结果。在这里,您可以检查哪些特征对预测影响最大,并探索散点图和图表,以了解数据值与欺诈分类之间的关系。
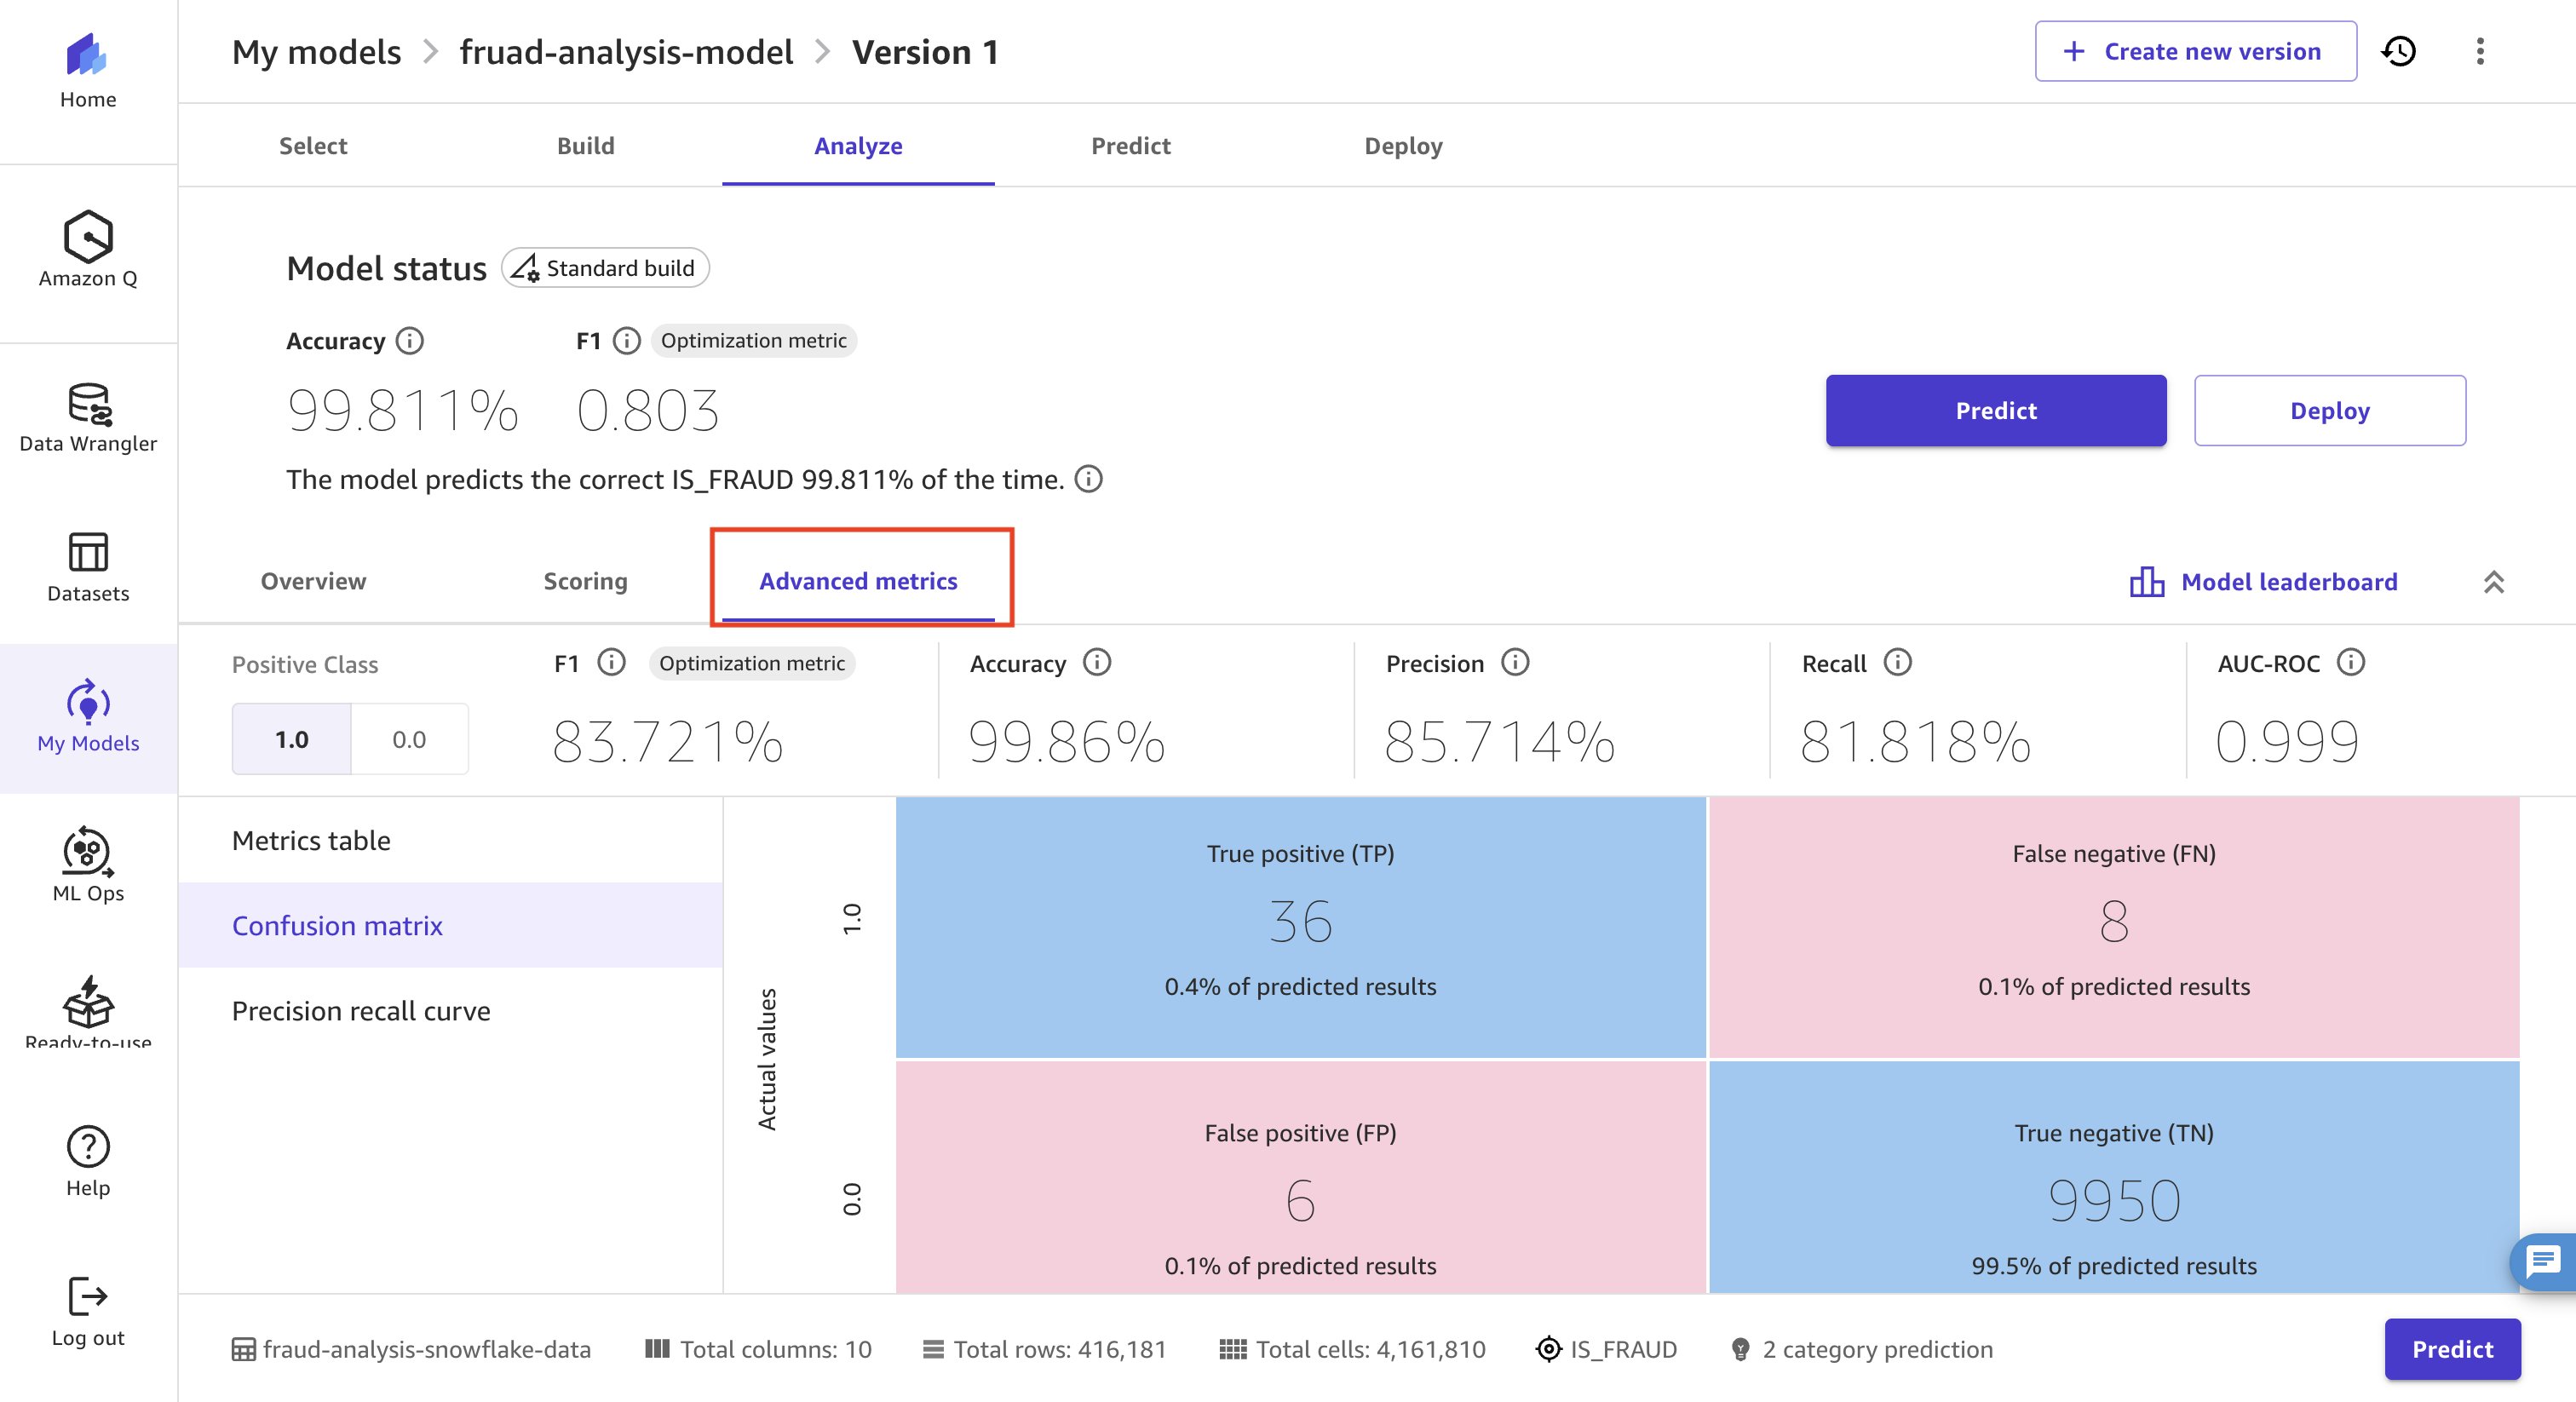
- 选择 Advanced Metrics 以进一步了解模型性能。
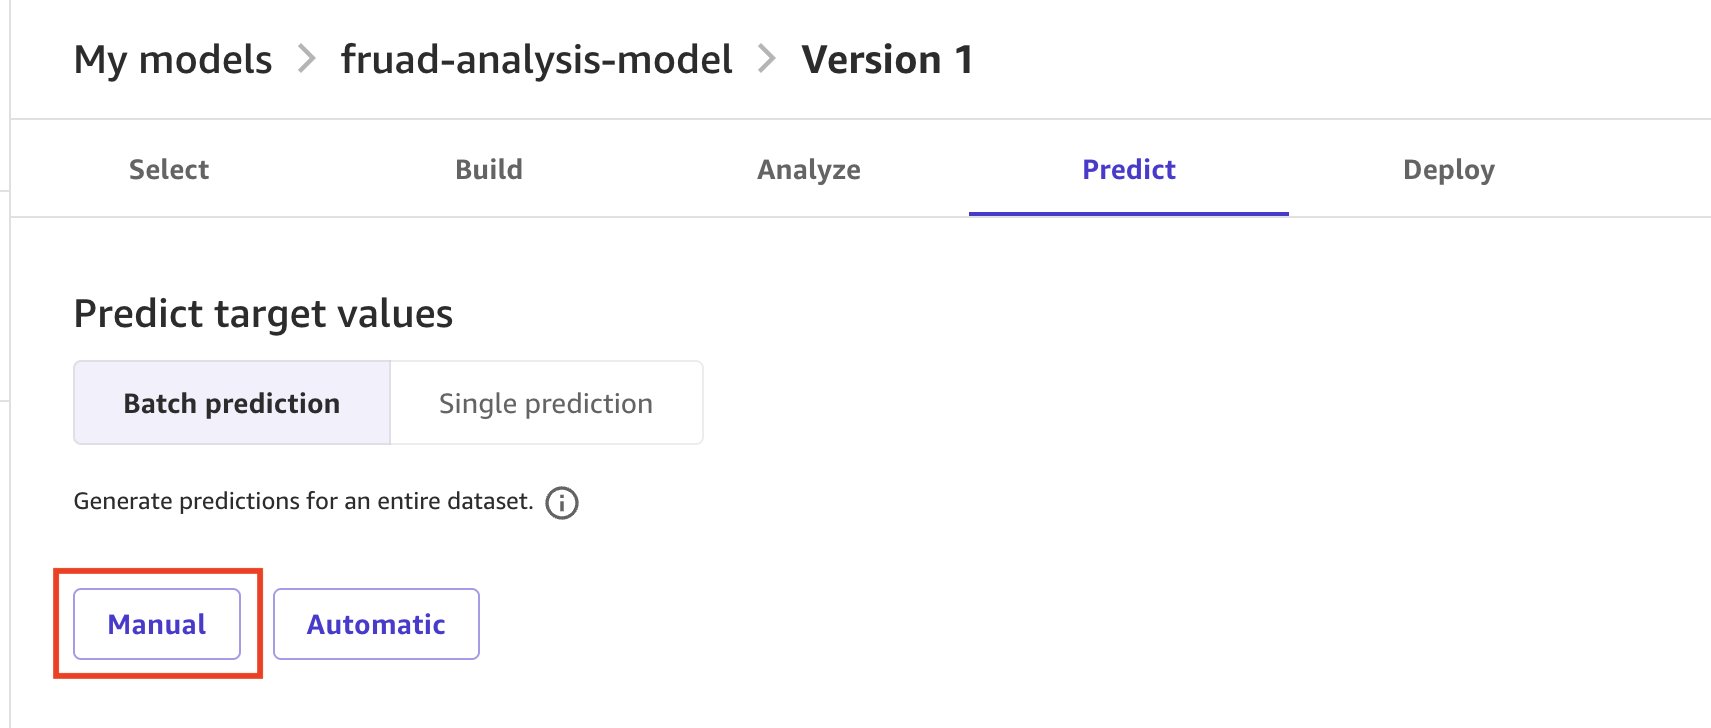
- 接下来,使用训练好的模型对未见过的数据集进行预测。下载示例预测 CSV 文件。导航到 Predict 选项卡。选择 Manual,然后选择 Create Dataset。
- 上传数据集,选择 Preview dataset,然后选择 Create dataset。数据集加载完成后,选择该数据集并选择 Generate Predictions。模型需要几分钟时间进行预测。请等待作业状态变为 Ready。
- 要使用 Amazon QuickSight 直观地分析结果,您必须首先验证以下前提条件(详见此处):验证 AWS 区域一致性:您的 QuickSight 账户必须与您的 Amazon SageMaker Canvas 域设置在相同的 AWS 区域。向您的 Amazon SageMaker 执行角色添加 Amazon QuickSight 权限:附加到您的 Amazon SageMaker 域的 AWS Identity and Access Management (IAM) 执行角色需要额外的权限才能将预测发送到 Amazon QuickSight。导航到 IAM 控制台,找到与您的 Amazon SageMaker 域关联的执行角色(在最初设置 Amazon SageMaker 域时创建),并按照此处所述添加所需的内联策略。授予 QuickSight 对 Amazon SageMaker S3 存储桶的访问权限:导航到 QuickSight,转到 Manage Accounts,然后从左侧导航窗格中选择 AWS Resources。确保选择了 Amazon Simple Storage Service (Amazon S3),并选择包含 Amazon SageMaker Canvas 生成的预测结果的相应 S3 存储桶,命名为 sagemaker-{region}-{account_id}。添加 QuickSight 用户:确保您想要共享预测结果的用户已以 Author 或 Admin 角色添加到您的 QuickSight 账户中。转到 Manage QuickSight,导航到 Manage users 以邀请新用户或验证现有用户。有关详细信息,请参阅 Managing user access。您将在发送预测时输入他们的用户名。
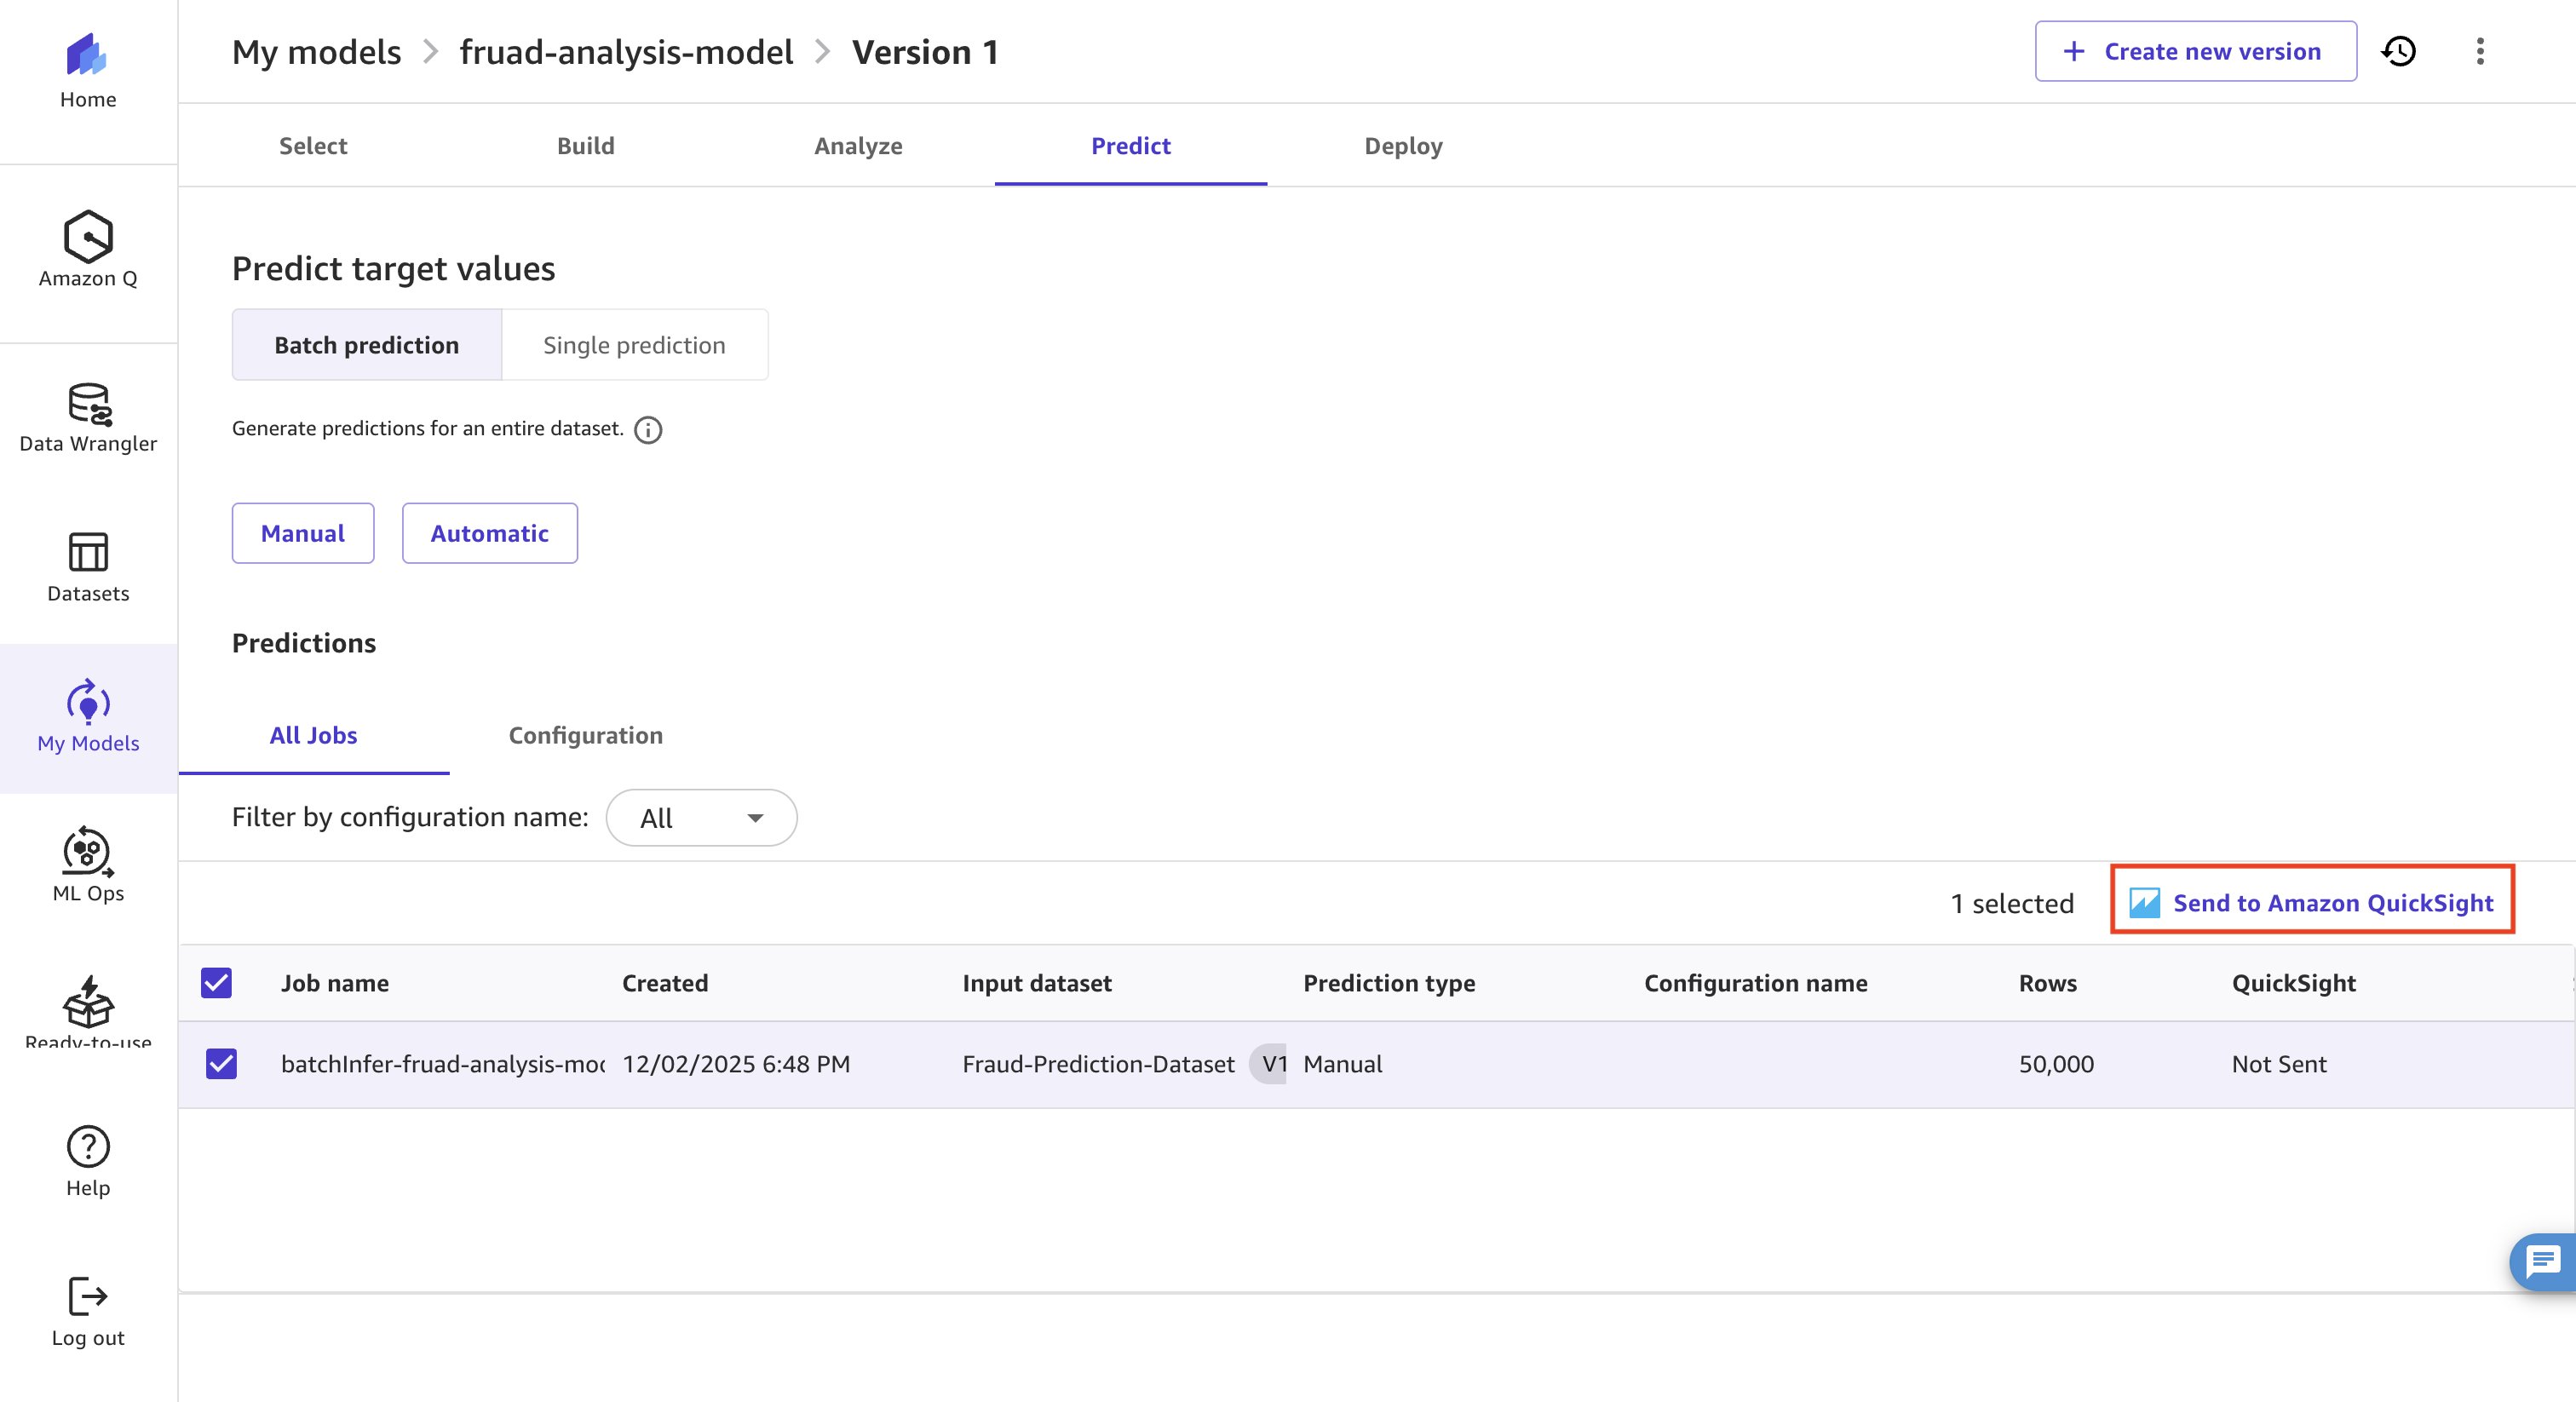
- 接下来,选择 Job name 并选择 Send to Amazon QuickSight。
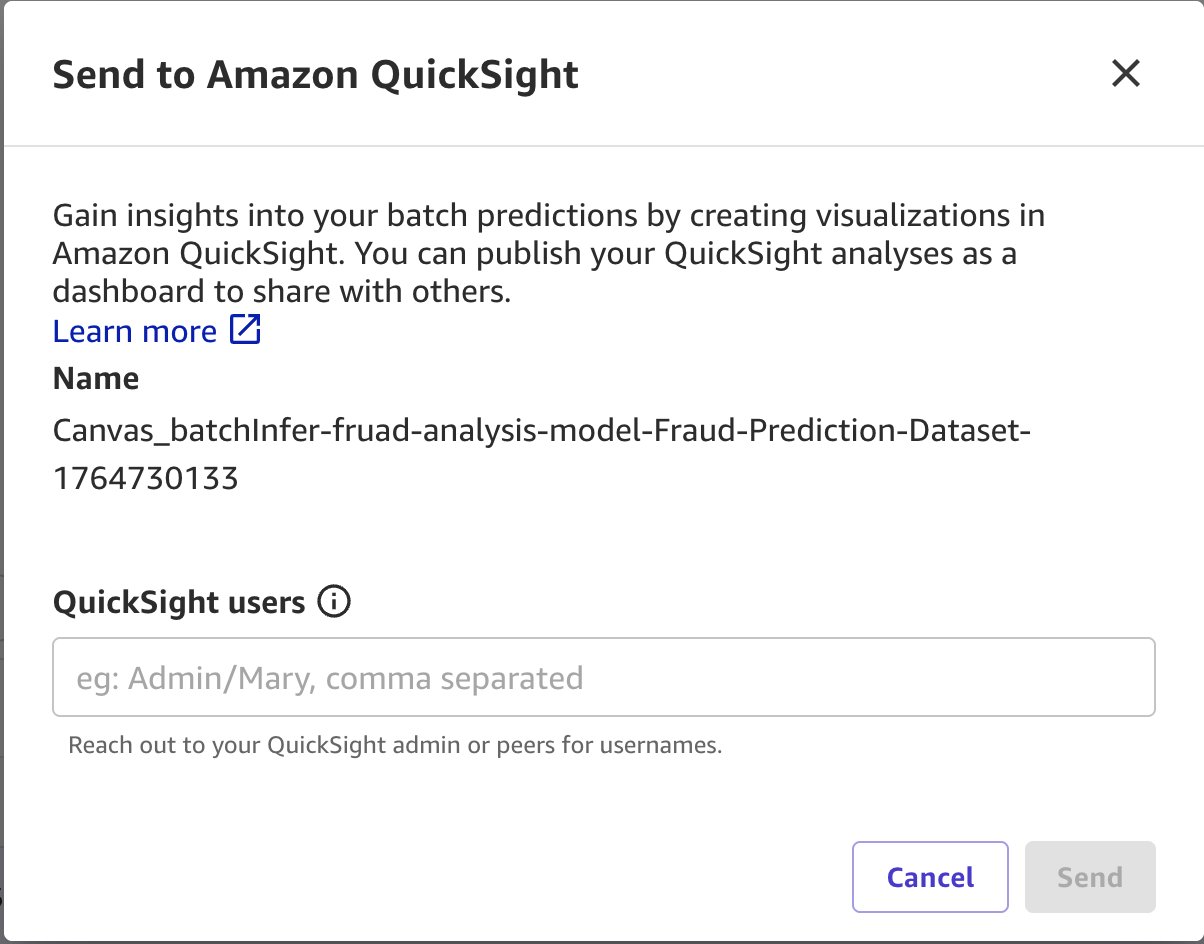
- 在新窗口中,添加之前已授予 Amazon QuickSight 权限的用户作为仪表板的查看者,然后选择 Send。
结论
第 2 部分涵盖了 Amazon SageMaker Canvas 中完整的数据准备和模型构建工作流程,从连接到 Snowflake 数据源和使用 Data Wrangler 的可视化转换进行特征工程,到连接多个数据源、分析数据质量以及训练欺诈检测模型,全程无需机器学习编程专业知识。随着训练好的模型现在能够对未见过的数据生成预测,这为第 3 部分奠定了基础,届时将通过 Amazon QuickSight 中的交互式仪表板将这些由机器学习驱动的洞察生动呈现。
参考文献
- 第 1 部分 – 使用 Snowflake、Amazon SageMaker Canvas 和 Amazon QuickSight 构建无代码 ML 工作流程 – 第 1 部分:设置您的 Snowflake 环境
- 第 3 部分 – 使用 Snowflake、Amazon SageMaker Canvas 和 Amazon QuickSight 构建无代码 ML 工作流程 – 第 3 部分:使用 Amazon QuickSight 可视化洞察
关于作者